Mobile-First Award 2025: Public voting for the best mobile apps in Ukraine is now open


 08.12.2017 10:00
The Ukrainian Retail Association presents a large-scale analytical report on the work of all major players of the e-commerce domestic segment.
All retailers, including those working in online-trading, try to get to know their buyer as much as possible. And at the same time they try to compare: what is the difference between its own client and the competitor buyer, and who is generally interested in acquiring a particular product on the Internet. And online-stores may to collect and analyze this information not as an example easier than its offline-counterparts: modern services provide an opportunity to get almost any data.
We set ourselves the goal to prepare the Ukrainian e-commerce market most ambitious analysis, to draw up an approximate portrait of domestic consumers buying goods online, also to analyze leading online-stores indicators in different segments. To collect information, we used Similarweb and alexa.com services, as well as the supplemented data from other open sources.
It is in addition to the general report: which segments of the online-commerce are more actively traded through the World Wide Web, who purchases most often goods in Ukraine on the Internet, and through which channels consumers are looking for information; we also have prepared a detailed analysis on e-commerce various sub-segments.
We have singled out supermarkets (such as Rozetka) into a separate category, where you can buy almost anything from spinners and spirits to squares and equipment for the “smart house” in order to avoid comparison of players with incomparable indicators. At the same time, there are no classic marketplaces in the report – olx, prom and others – because it does not sell its own goods, but act as a platform for contact between the buyer and the seller. Of course, products of many other companies are represented on the same Rozetka, but a platform began the road to the classical marketplace a little more than two years ago, and still sells a fair amount of the assortment on its own.
The study covers eight segments: department stores, portable electronics and gadgets, home appliances, fashion, sports goods, jewelry retail, children’s products, cosmetics and drogerie. Our team analyzed by several criteria each of its: the user’s age, the main input channels, the used devices (PCs and laptops or smartphones and tablets), unique visits and failures number, the prevailing social chain in a particular segment.
In addition, each of five leaders in this sphere was analyzed on the audience coverage and attendance (data are given as a percentage of top-5 online-stores total attendance, but not generally in the industry as a lot of retailers work sometimes with scanty coverage rates in the segment).
This report allows, like any analyst, online-retailers to find out its weaknesses and strengths, to get acquainted with the buyer portrait in the segment and to compare it with own customer data. In addition, information about main traffic channels and most effective social chains will help to correct SEO and SMM-promotion strategies for increasing brand awareness and attracting new users, to assess the need and prospects for creating and implementing mobile applications and adaptive layouts, and also to extract much other useful information.
We hope that our analytical report will be useful for you!
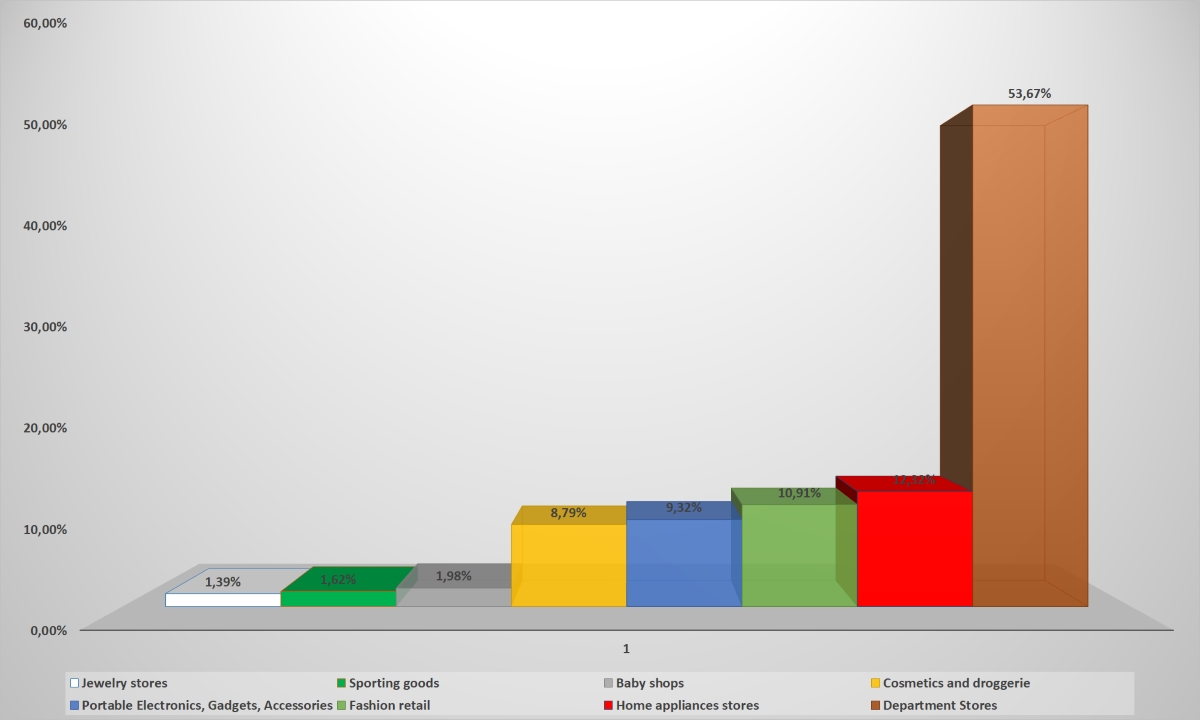
Supermarkets are the undisputed leader among all retail-trade spheres via the Internet, where you can buy everything at once. Indeed, why waste time, if you can buy on Rozetka and equipment, and drugs, and food, and much more? And not only cameras and smartphones, but also tools, tires and so on have on F.ua in the assortment. So the final coverage rates of 53.7% (assuming a 100% total indicator for all categories) are quite an expected figure.
The others are considerably behind. Home appliances achieved coverage of 12.3%, fashion retail – 11%, portable electronics and cosmetics – about 9% each. The remaining categories have reach in total coverage of 5%.
Diagram: Audience reach (click on it to enlarge the picture)
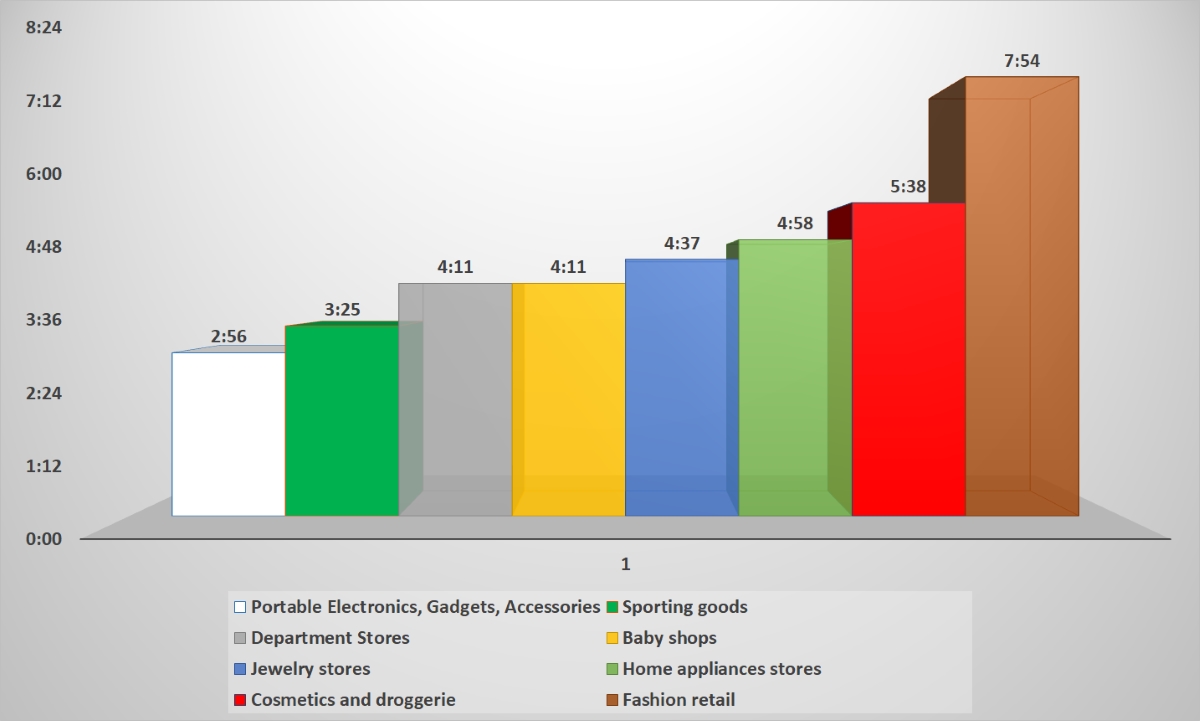
But if “universals” are on the audience reach out of competition, then other sectors are leading by two other key indicators – the time spent on the site and the view depth. The longest time users stay on the fashion-retailers sites: almost 8 minutes. Obviously, the outfit’s selection is not such a simple thing.
Buyers spend on staying on the dealer’s cosmetics and perfumes site a little less – 5 and half of minutes. The segment “appliances for home” with indicator of just under 5 minutes is in the third place. Portable electronics and gadgets buyers are the quickest to choose from. Taking into account the fact that mainly young consumers are interested in this goods category, the rush is quite understandable.
Diagram: Time of the user’s stay on the site (to enlarge the picture click on it)
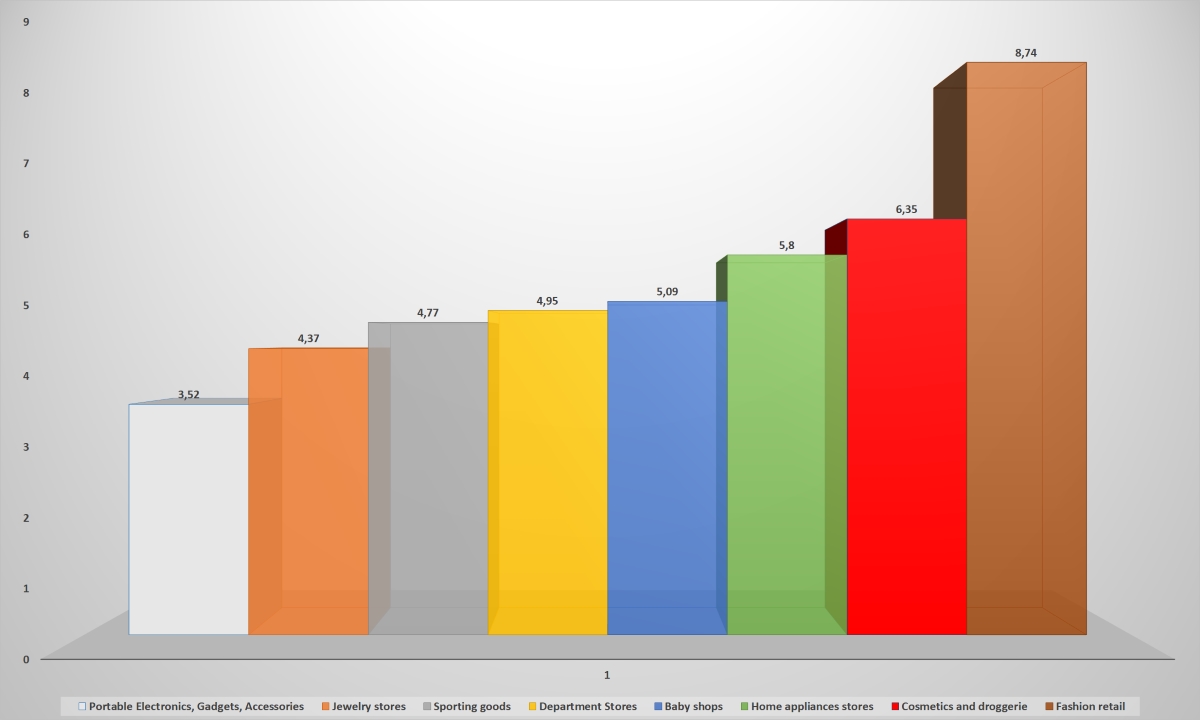
Fashion-stores top the rating and on view depth. On average, one user who visited the site of this retailers-segment, 8.74 times passes from page to page. In the others, this indicator is more modest: cosmetics buyers visit 6.35 pages per session, and appliances for home – 5.8. The portable electronics again closes the rating – only 3.5 pages per visit.
Diagram: View depth (to enlarge the picture, click on it)
Statistics on the consumers “entry points” on interesting to them sites is equally curious. Despite the widespread belief that now a traffic significant percentage is generated in social chains, in fact, it provides only 4.25% visits to online-stores. Users get to online-retailers much more often through standard search engines (such as Google) – more than a third of calls, 37.35%. Next most popular are exact visits to the site (when the user, for example, immediately dials in the address-bar rau.ua) and transitions from other sites via hyperlinks (referrals). Contextual advertising (when companies receive payment for getting to the search engines top-lines when searching for certain words or goods) takes a share of 12.82%.
Diagram: Traffic sources (click on it to enlarge the picture)
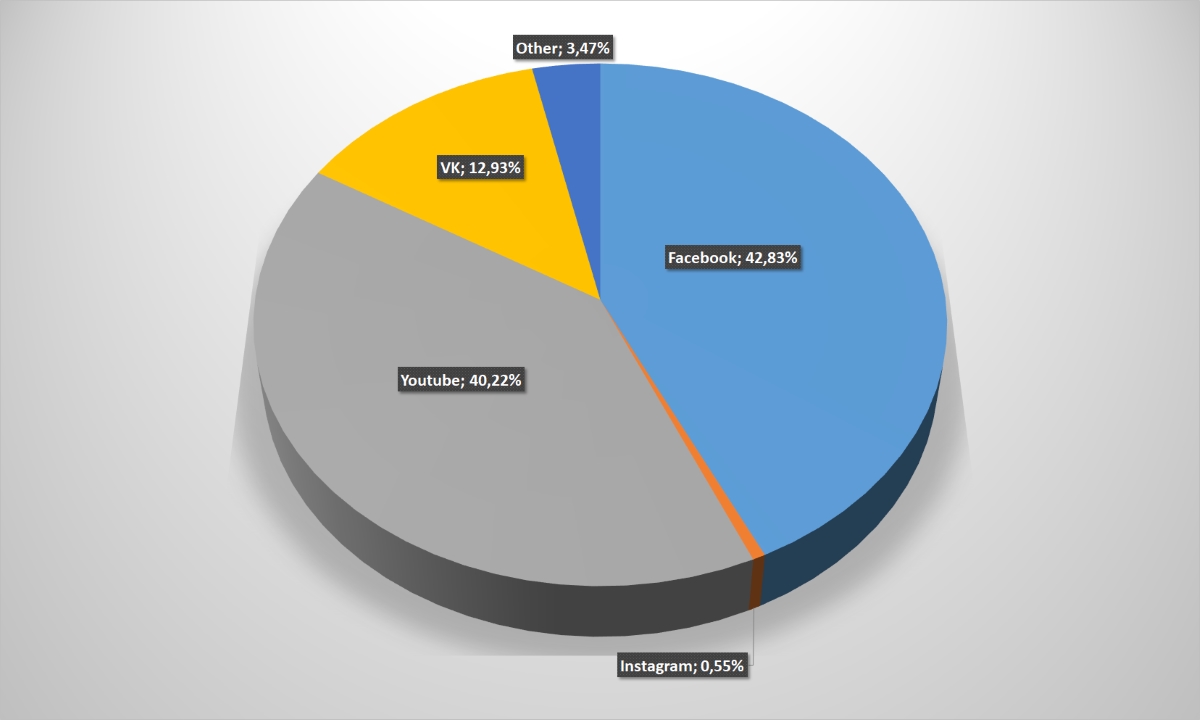
Leaders and outsiders were clearly divided inside the social chains itselves. Facebook and Youtube collectively provide more than 80% of conversions to online-merchant sites. Curiously, Russian chain VKontakte, officially banned in Ukraine, still provided for the year to online-store with almost 13% of traffic from social chains. True, it is impossible to say how much this indicator has changed, without having data on statistics a year earlier. Other social chains (Instagram, twitter, google + and others) can be neglected.
Diagram: Transitions to online-store site from social chains (click on it to enlarge the picture)
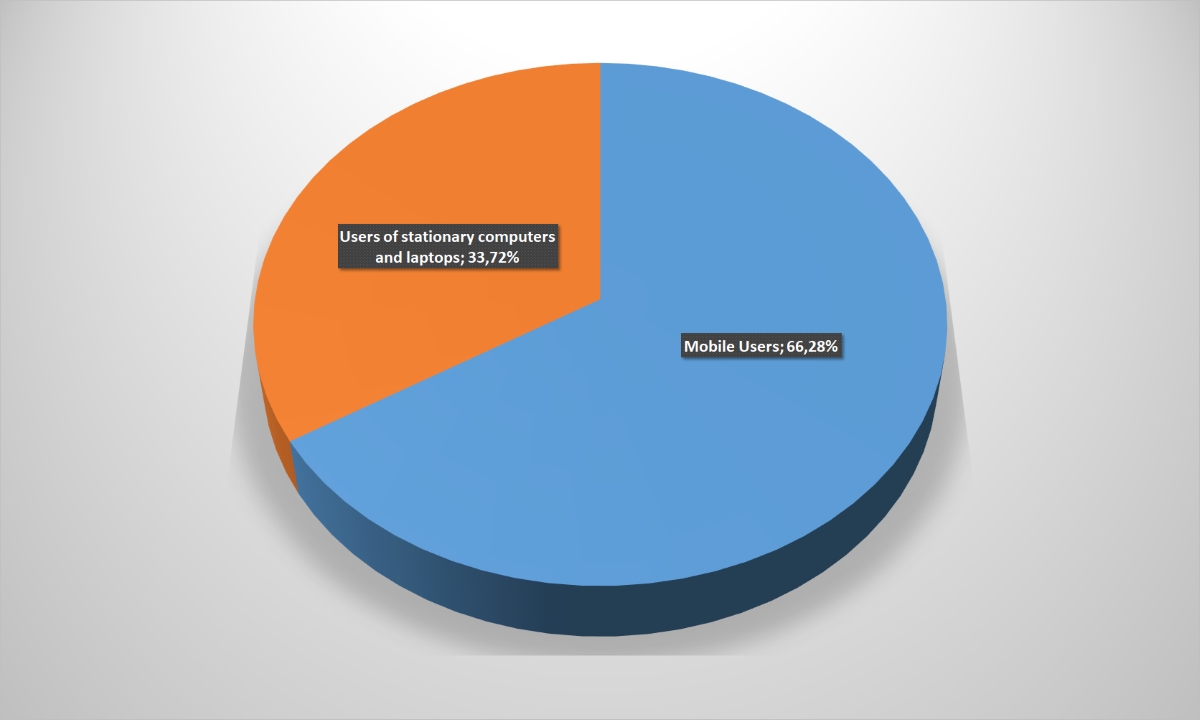
Two thirds of the Ukrainian visitors to online-stores use mobile devices to access the Internet. The 3G-technology introduction accelerated markedly the Internet-“mobilization” and forced retailers to introduce new technologies more actively.
Diagram: Devices employed by users to access the Internet (click on it to enlarge the picture)
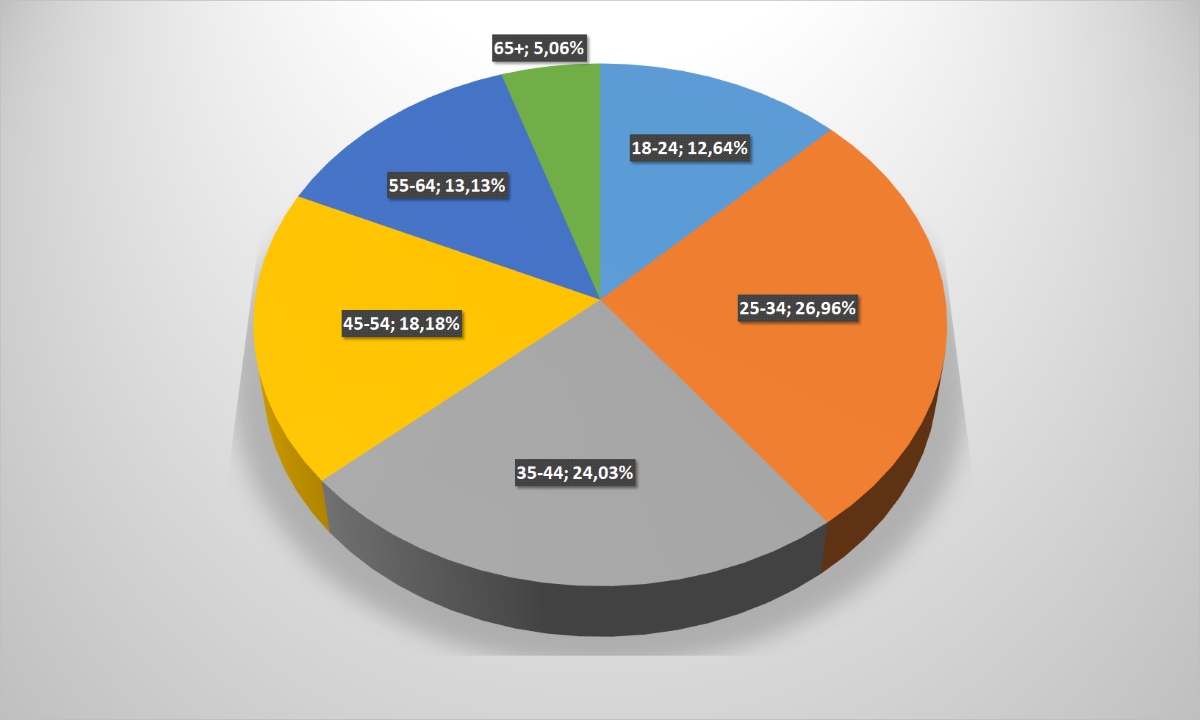
The users general age cut did not bring any surprises. More than 50% of online-stores customers are people from 25 to 44 years, another 30% – age categories 18-24 and 45-54. The older generation (over 55) provides the Ukrainian online-retailers with a modest 18%.
Diagram: Age user’s category (to enlarge the picture, click on it)
 But the picture can significantly differ for domestic e-commerce in some sectors from the “average temperature in the hospital,” which is not hard to see.

As supermarkets are leading among the Ukrainian e-commerce various segments with a solid margin, as there is a clear leader among its – Rozetka.ua with an audience coverage of 60.7% (coverage among this category top-5 portals). The remaining market participants are noticeably behind.
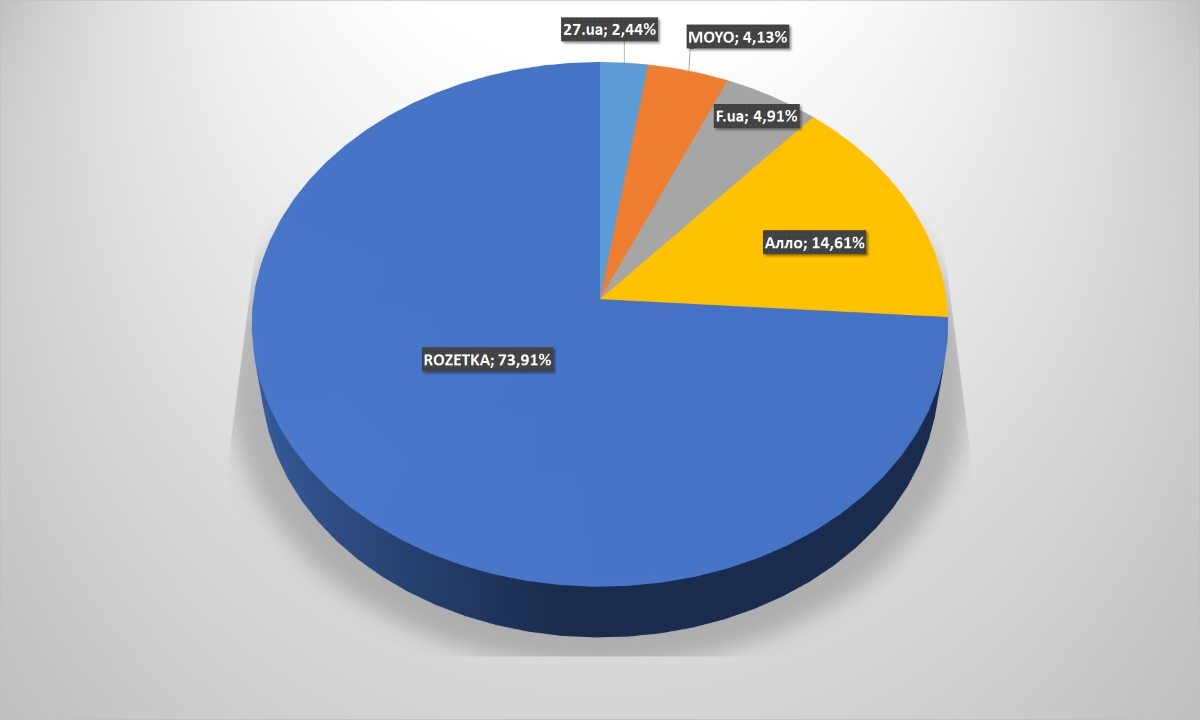
Rozetka confidently leads on the attendance by unique users – almost three quarters of consumers among the “big five” of the Ukrainian Internet-supermarkets prefer this portal.
Diagram: Audience reach (click on it to enlarge the picture)
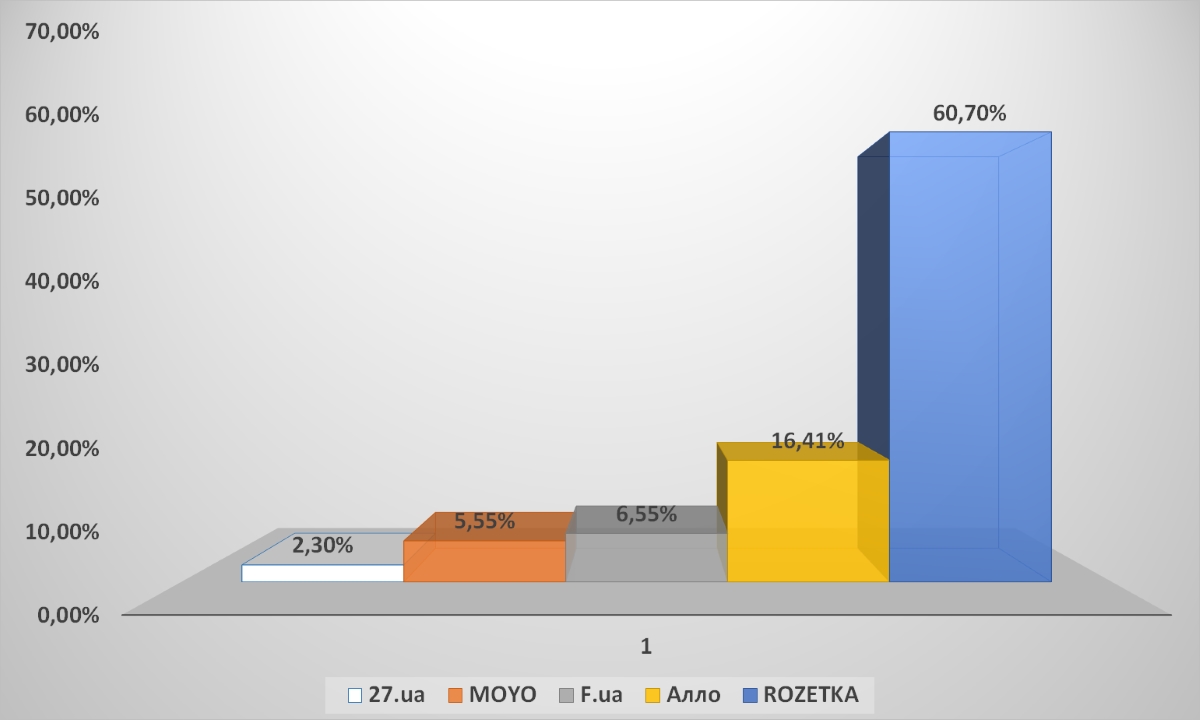
Diagram: Sites attendance by unique users (to enlarge the picture, click on it)
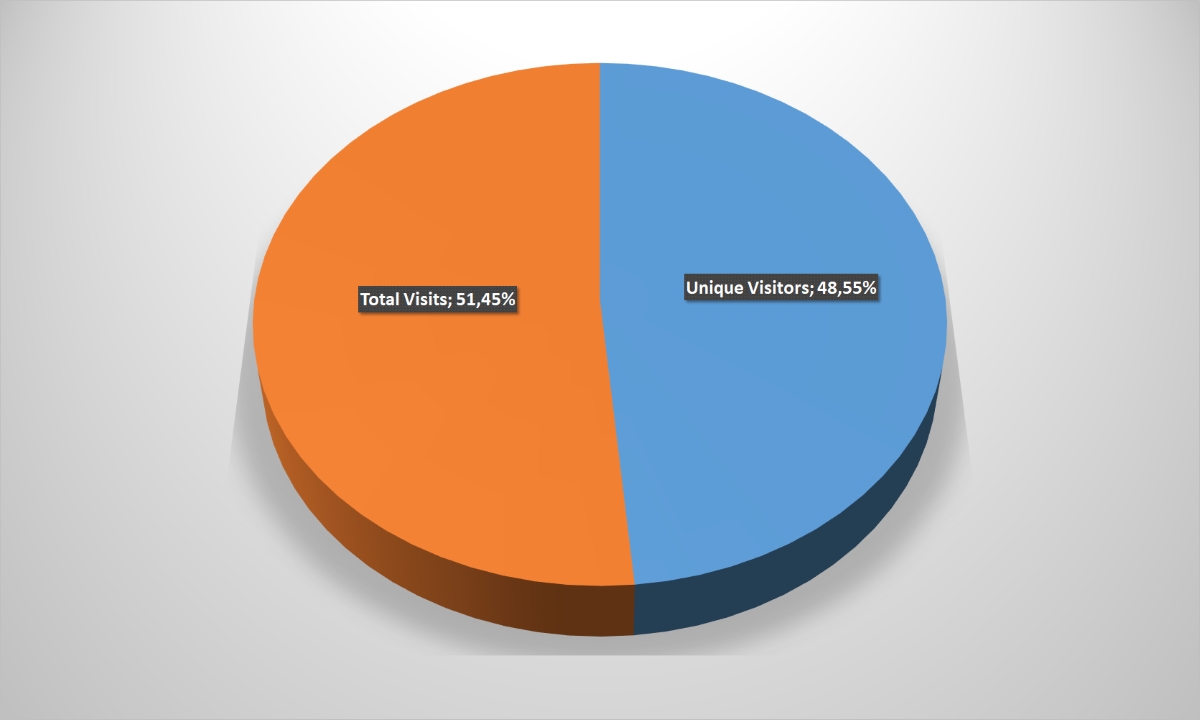
At the same time, on average, less than half of users visited the online-store only once a year – 48.55%. The rest of customers visited at least one online retailer twice or more.
Diagram: the unique and repetitive user’s ratio (to enlarge the picture, click on it)
Universal online-stores often attract customers with hyperlinks on other sites (+ 3.8%), social chains (+ 1.2%), as well as banner (+ 1.6%) and contextual (+ 0.6%) advertising, compared to general e-commerce indicators. But indicators are worse in the search engines (-2.4%) and direct calls (-3%).
Diagram: Traffic sources (click on it to enlarge the picture)
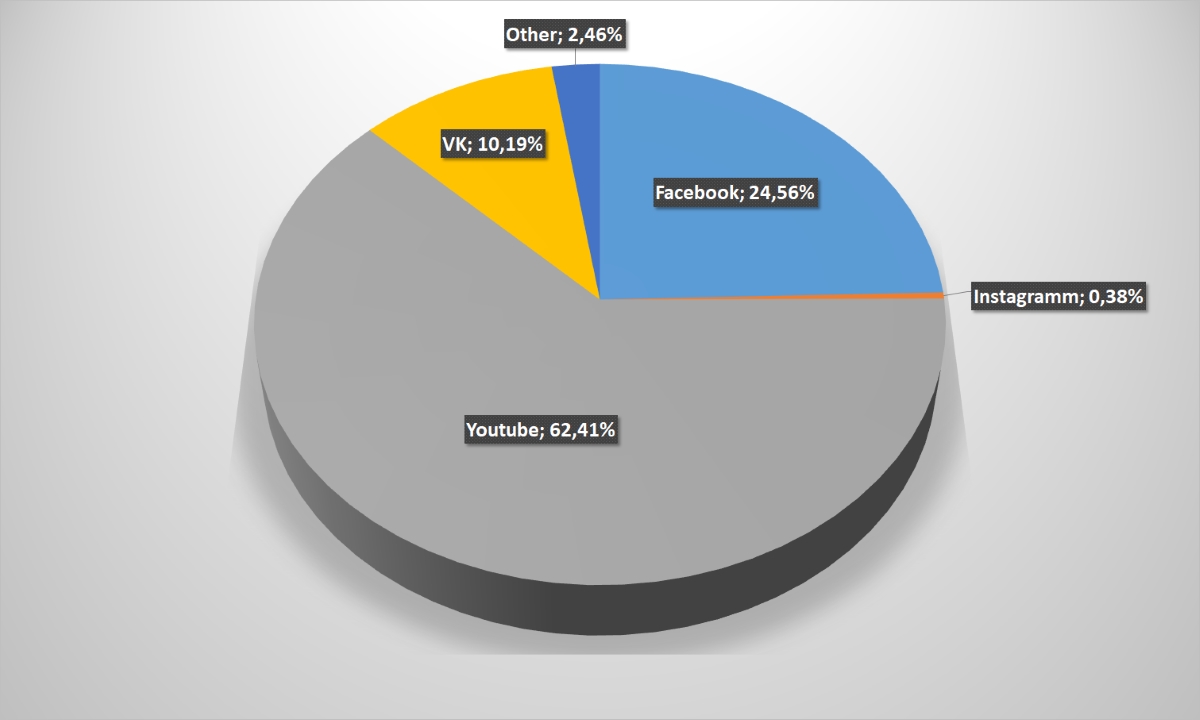
Youtube is the traffic main source from social chains for this online-merchants segment – 62.4%, one and a half times more than the average for the market. At the same time, Facebook “sagged” – from this social chain to the portals of “universals” came in just 24.6% of visitors against 42.8% of the average. Obviously, recently launched video-reviews of new technology help to lure customers to the company’s page, which successfully use F.ua and Rozetka.
Diagram: Transitions to the online-store site from social chains (click on it to enlarge the picture)
What is noteworthy: quite a lot of users (especially in comparison with the market average index) visit “supermarkets” from stationary computers and laptops. However, the client’s age categories analysis helps to explain this trend. Among buyers of this segment online-retailers are quite a lot of people over 45 years old – as much as 44%! And more than two thirds of them are at the age of “55”. Most likely, namely this customer’s category provides a high level of PCs and laptops users.
Diagram: Devices employed by users to access the Internet (click on it to enlarge the picture)
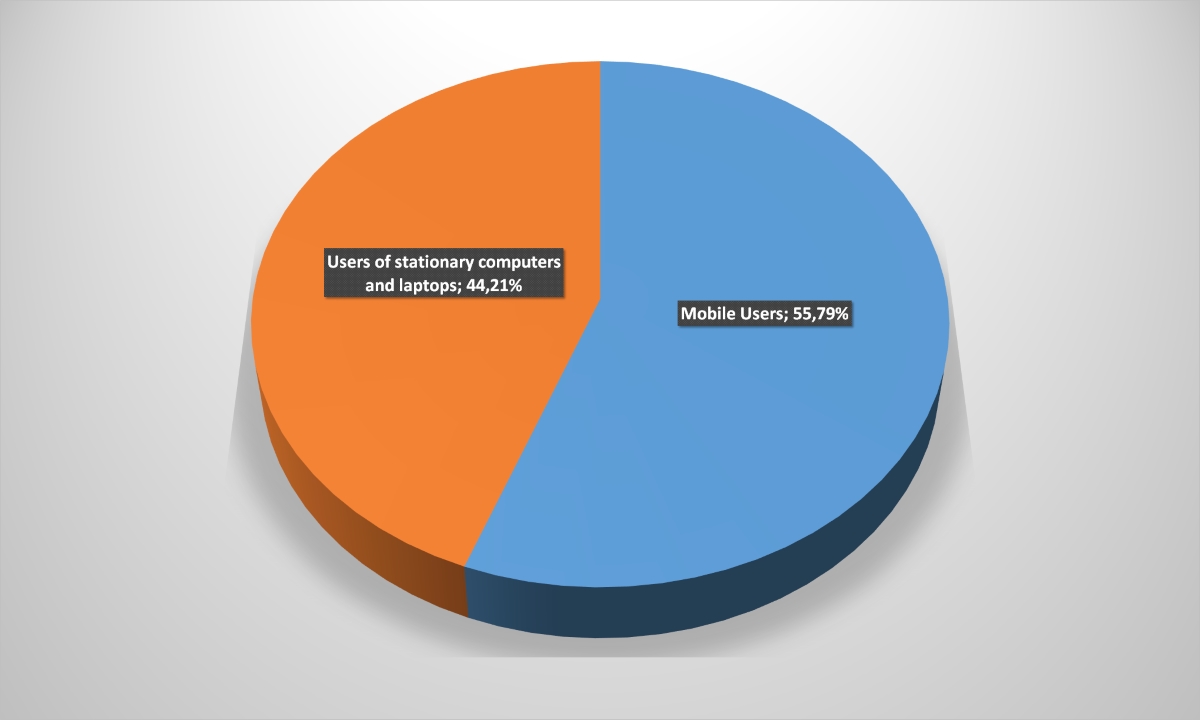
Diagram: User’s age category (to enlarge the picture, click on it)
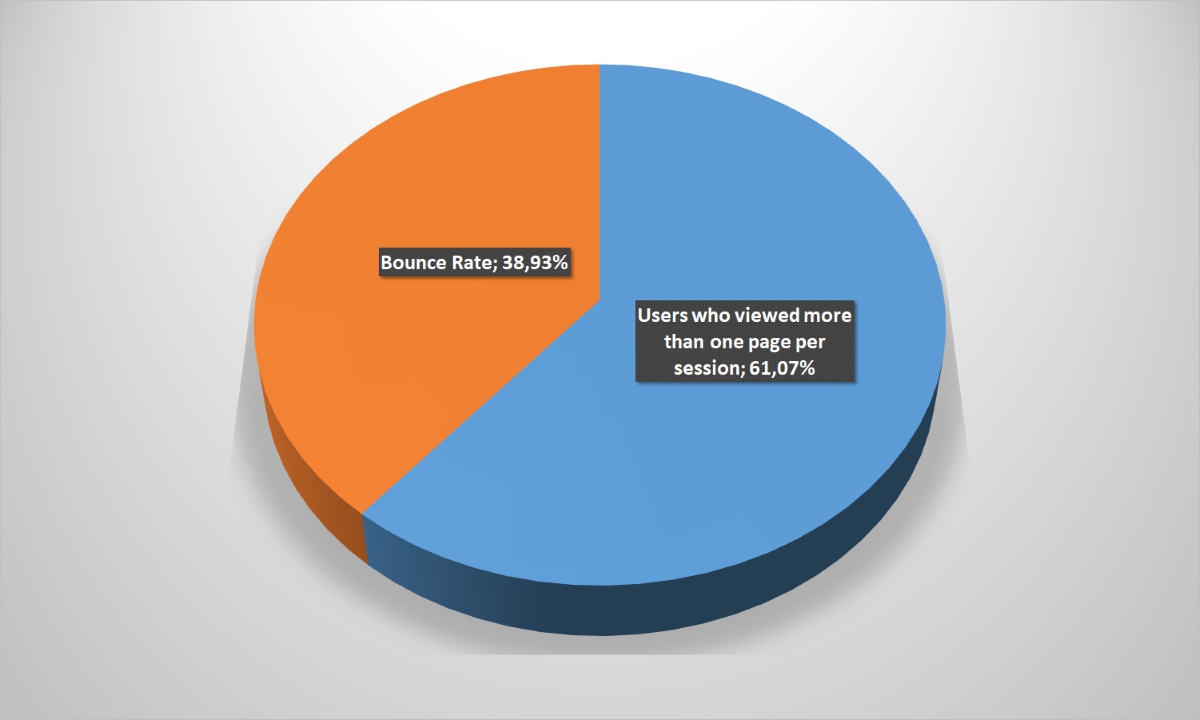
Finally, such indicator as the percentage of refusals is critical important for each online-store. These are those customers who came to the site and immediately left – without going to any other portal page. That is, they left the site without a purchase. It is clear that the rest do not necessarily buy something, but at least they will spend more time on the site and learn about the assortment, promotions and other news. Real conversion rates are known only by retailers themselves.
The percentage of failures is less than half in the supermarket’s segment – 42% of users limited only one page viewing.
Diagram: Percentage of failures (to enlarge the picture, click on it)
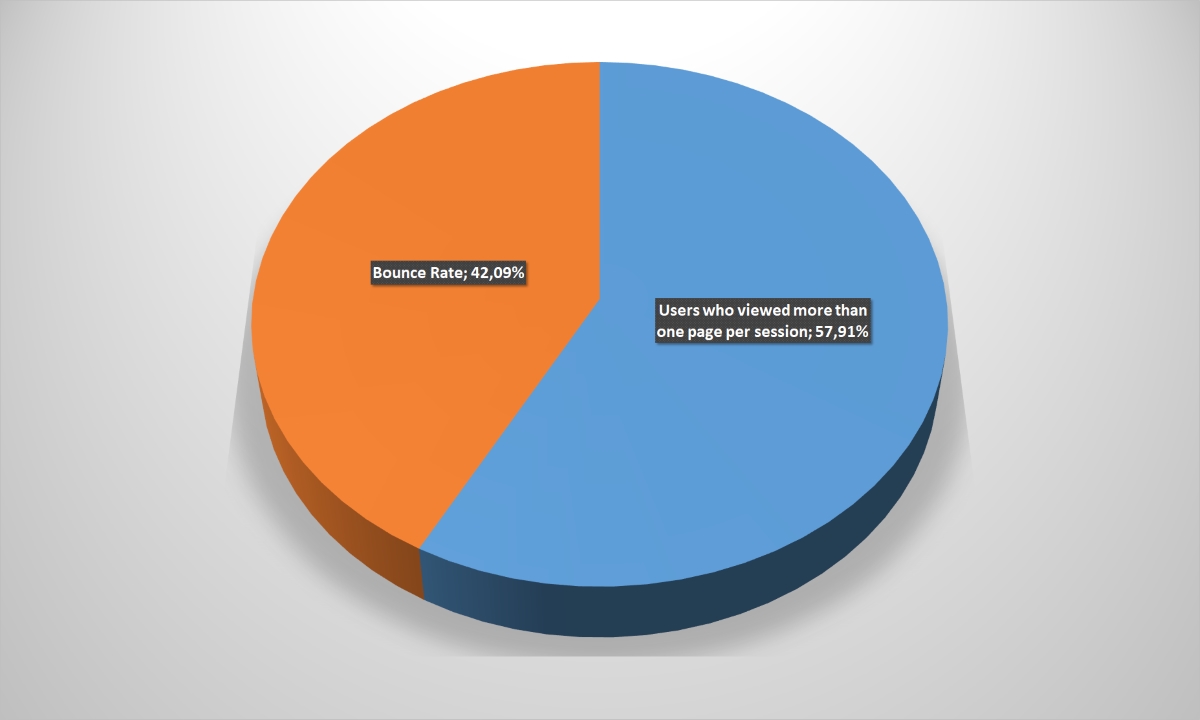

Even more notable leader is present among stores offering their customers gadgets and accessories. Citrus separation from its pursuers is simply indecent – 73.4% of the user’s coverage among the top-5 audience of this segment e-commerce speaks for itself.
Competitors are hopelessly losing both in audience reach and in attendance – in total they could not even collect 10% of unique Internet users who looked at least one of these five retailers portals.
Diagram: Audience reach (click on it to enlarge the picture)
Diagram: Sites attendance by unique users (to enlarge the picture, click on it)
And that, the audience is somewhat more stable in this category: 58% of repeat users versus 42% of “one-time-partners.” Perhaps, this explains Citrus high indexes.
Diagram: The unique and repetitive user’s ratio (to enlarge the picture, click on it)
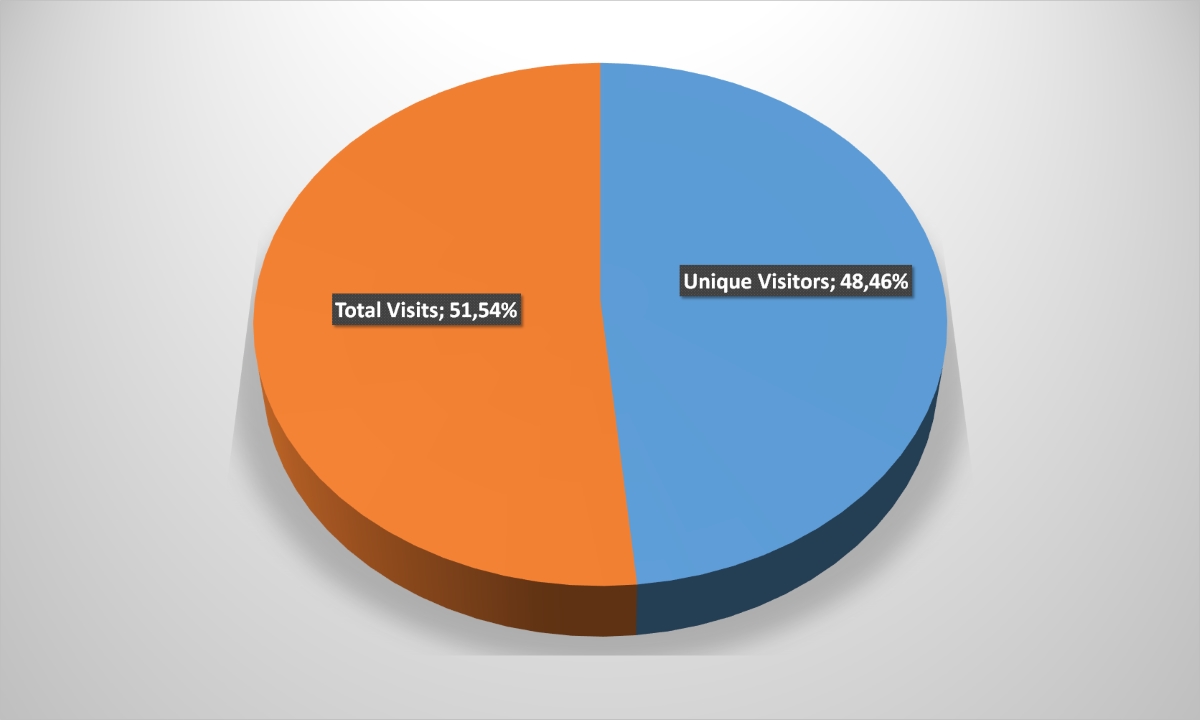
Traffic sources for online-gadget-stores coincide generally with the market average. Except that half number of customers comes with e-mail newsletters, and several more – using hyperlinks on other portals. Remaining indicators are quite comparable.
Diagram: Traffic sources (click on it to enlarge the picture)
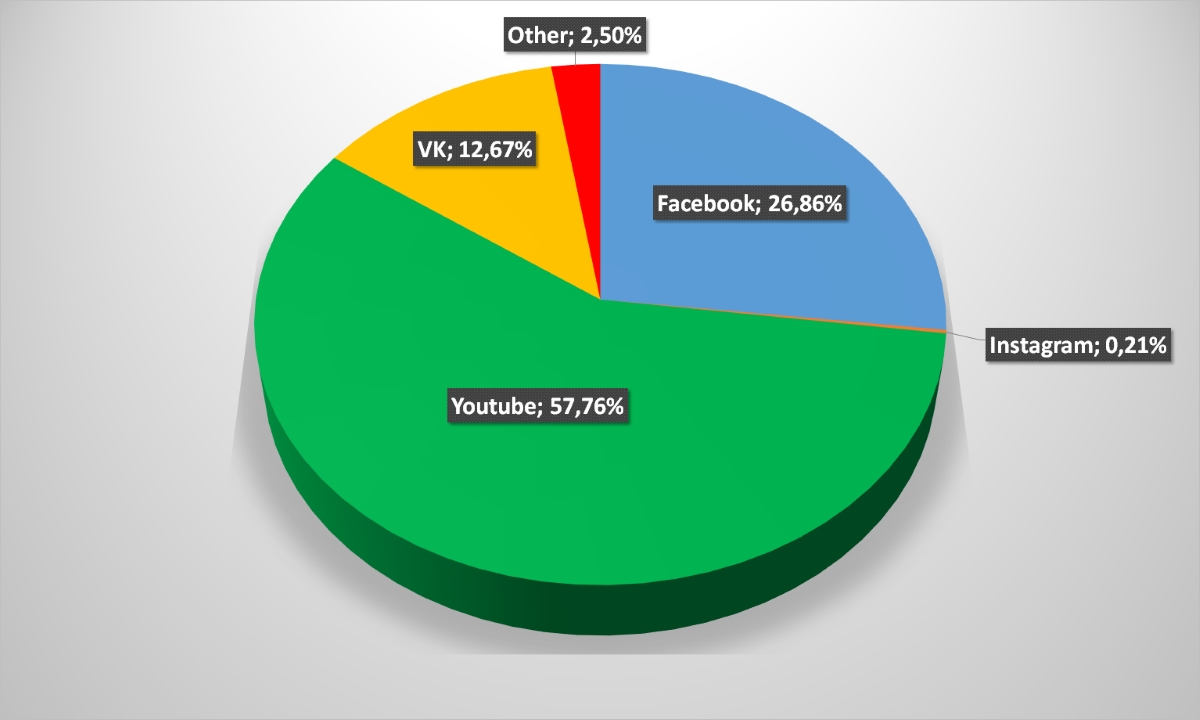
But the picture attracting customers from social chains is much closer to universal online-stores – the user’s main stream comes from Youtube. Again, due to the fact that video-reviews are often more interesting to potential customers than even good static indicators.
Diagram: Transitions to the online-store site from social chains (click on it to enlarge the picture)
But these segment indicators again return to the average market according to the next indicator – used devices: more than two thirds of users come from mobile devices. This is quite logical due to the client’s average age of gadget-stores and accessories: three-quarters of them are under 45 years old.
Diagram: Devices employed by users to access the Internet (click on it to enlarge the picture)
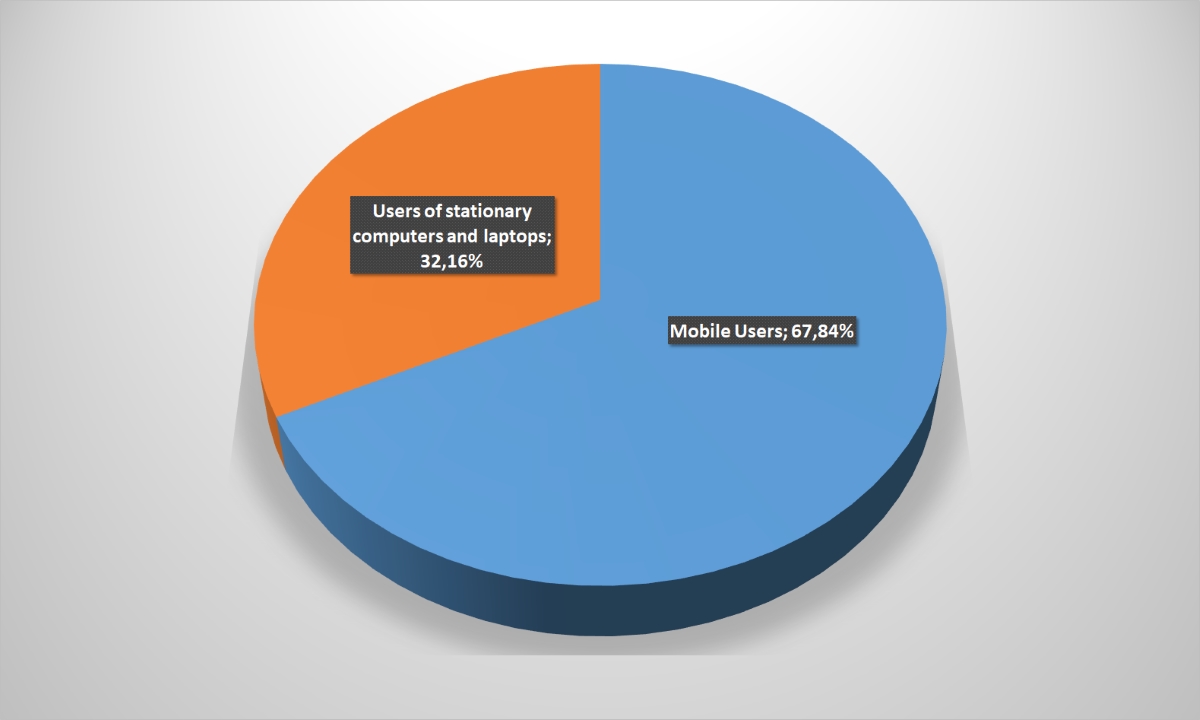
Diagram: User’s age category (to enlarge the picture, click on it)
The number of failures did not surprise in general and is identical to this indicator for universal online-stores.
Diagram: Percentage of failures (to enlarge the picture, click on it)

We have identified only three players in this subcategory: all others lose by the attendance by several dozen, or even hundreds of times, and comparing it’s to three leaders is pointless. And the picture immediately changed. Segment “household goods” corellas – Comfy, Foxtrot and Eldorado – have coverage in 42.5%, 34.1% and 17.8%, respectively. Totally, it occupies more than 94% of the market, practically leaving almost no room for other operators.
The “three fat people” attendance was noticeably evenly distributed. 45.34% preferred Comfy, 35.53% – Foxtrot and 19.13% chose Eldorado among the segment leader’s fans.
Diagram: Audience reach (click on it to enlarge the picture)
Diagram: Sites attendance by unique users (to enlarge the picture, click on it)
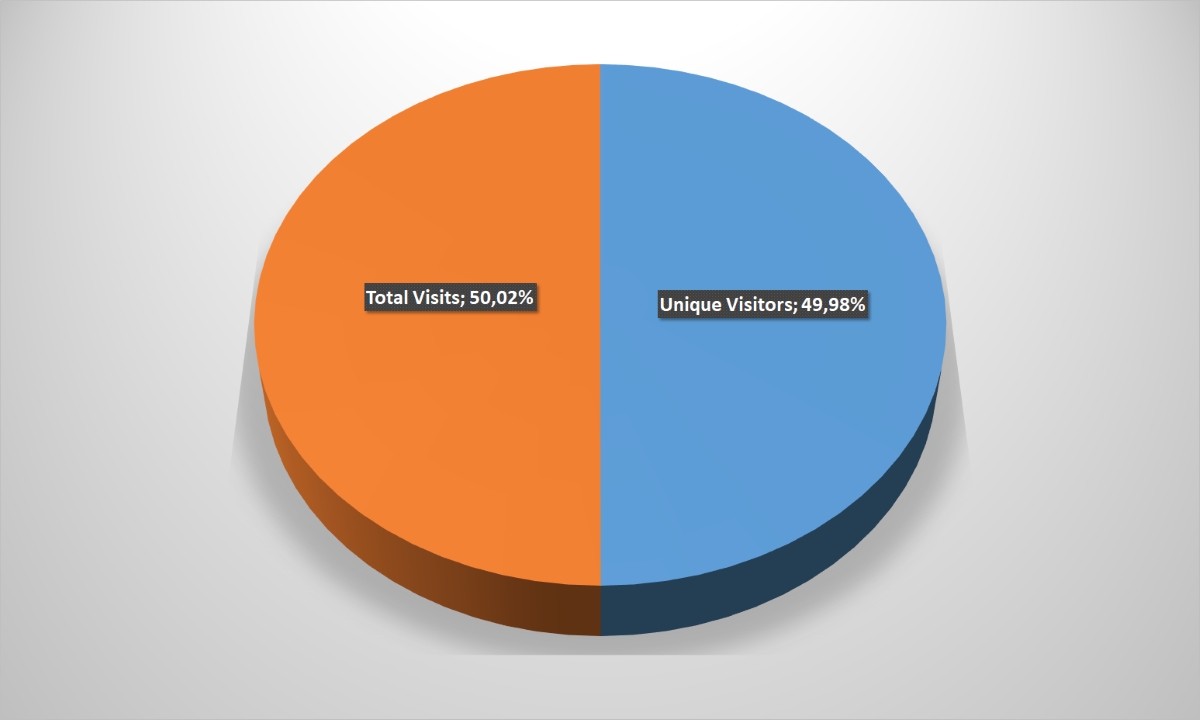
If we exclude small players from the algorithm, then the new and returning user’s percentage for the leaders will be almost the same – 0.4% of the difference can be ignored.
Diagram: The unique and repetitive user’s ratio (to enlarge the picture, click on it)
At the same time, customers “entry points” differ slightly. Home appliances stores are 5% ahead on the organic search market, the contextual advertising and e-mail transitions, but it are inferior in direct calls and visits through hyperlinks and social chains.
Diagram: Traffic sources (click on it to enlarge the picture)
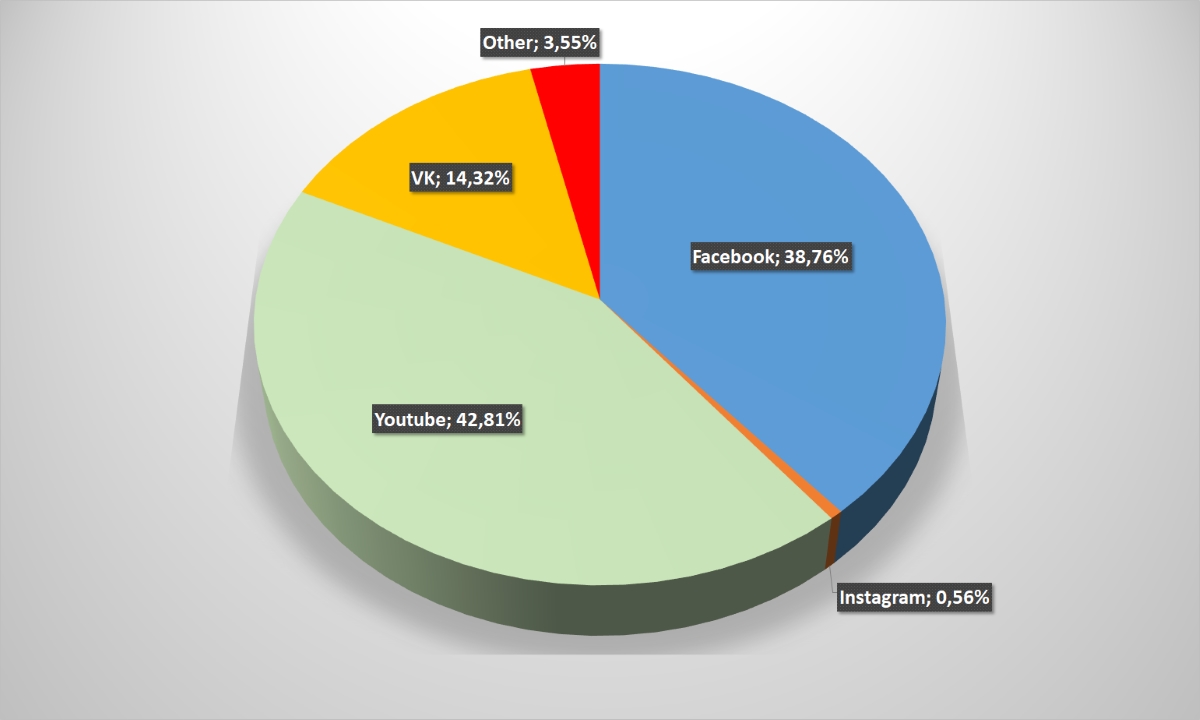
 But Facebook is played an unusually large share in attracting users from this retailer’s category – Foxtrot, Eldorado and Comfy are giving a lot of attention to the most popular social chain in Ukraine, unlike supermarkets and gadget sellers. High Youtube indicators can be explained, probably, by Comfy’s over-the-top advertising campaign with the Saint-Tropez group involvement.
Diagram: Transitions to the online-store site from social chains (click on it to enlarge the picture)
At the same time, if online-stores for home appliances demonstrate average market indicators in the ratio of calls from mobile and fixed devices, its customer’s age cut is very diverse. On the one hand, more than half of users are under the age of 45, but on other hand, their percentage superiority over the older generations is not as tangible as, for example, in the gadget seller’s case.
Diagram: Devices employed by users to access the Internet (click on it to enlarge the picture)
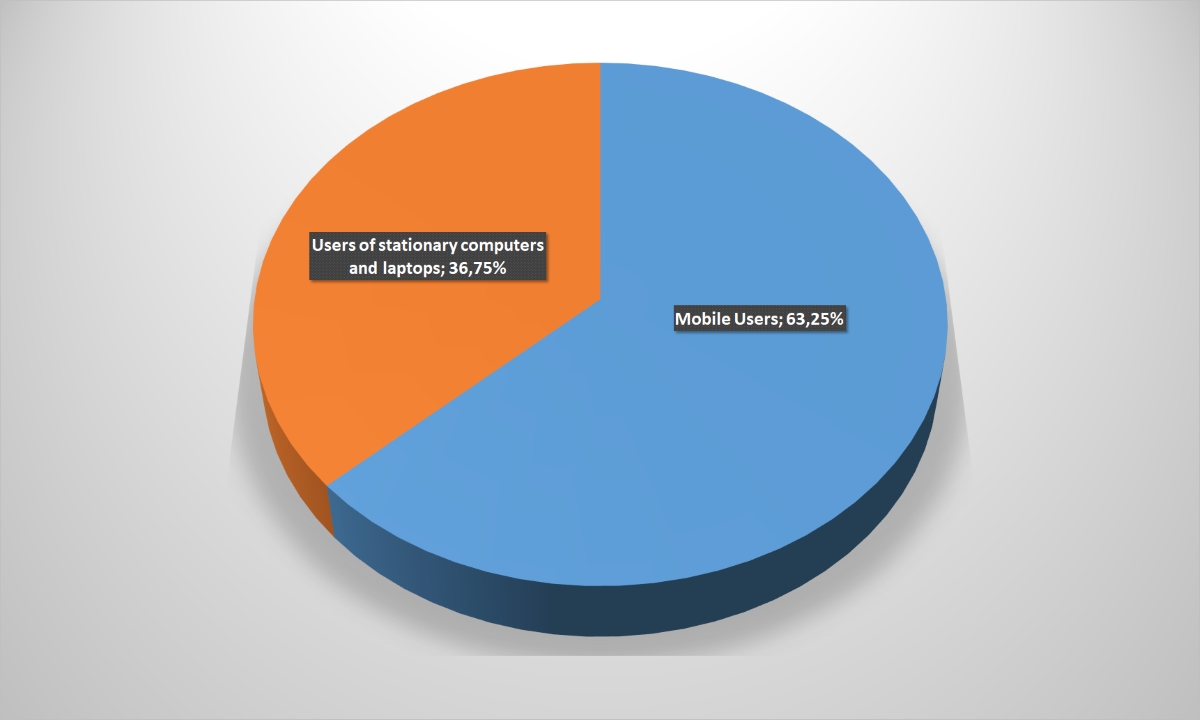
Diagram: User’s age category (to enlarge the picture, click on it)
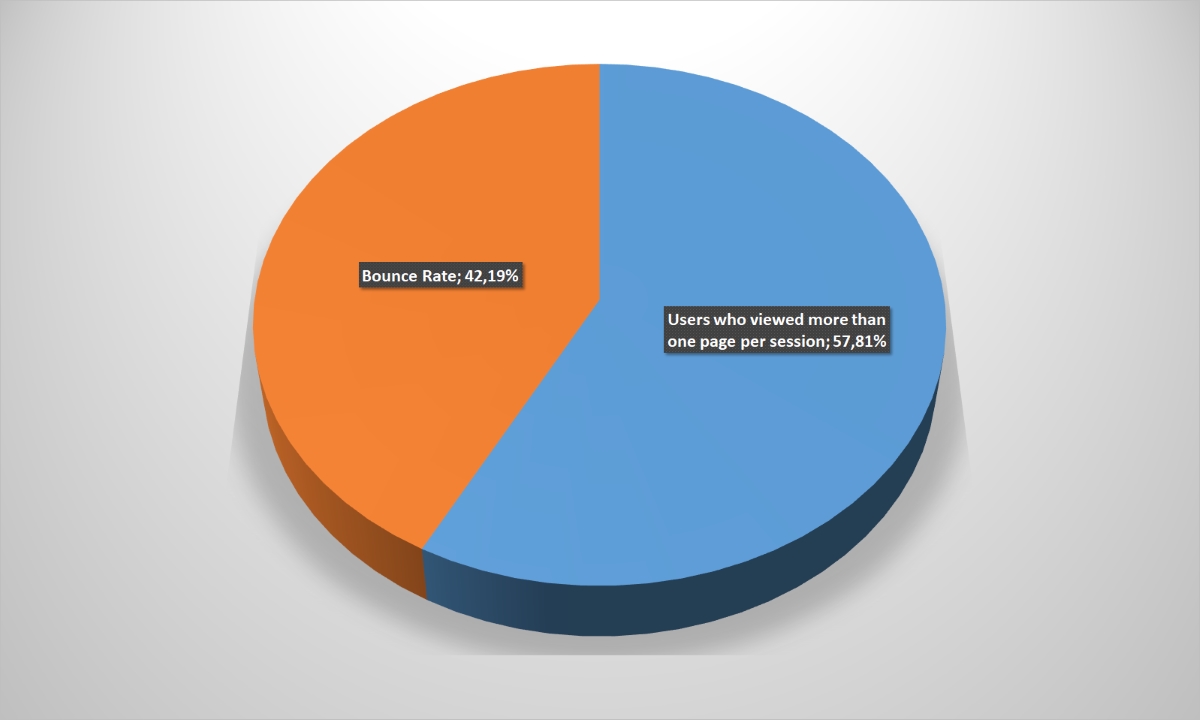
The failures rate is different for the better. Only 40% of users interrupt their visit on the first page, and 60% continue to study the online-store assortment.
Diagram: Percentage of failures (to enlarge the picture, click on it)
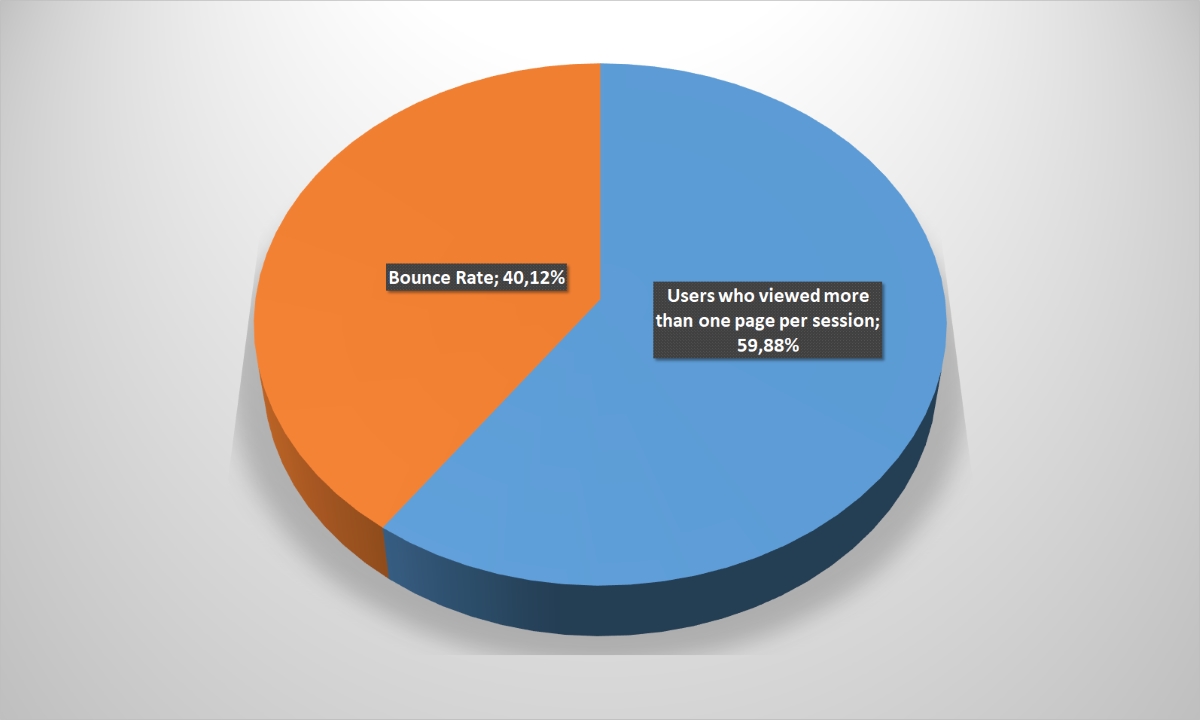

It is worth noting, that only Intertop from the presented companies sells exclusively its own products analyzing this direction leaders. modnaKasta, Lamoda and LeBoutique already work in the marketplace format. But since own stocks make up a significant percentage of goods, excluding it from the online-stores rating and refer only to marketplaces would not be true.
Nevertheless, the model chosen by its allows confidently to increase the audience reach and the threesome control two thirds of the market. Given this, the online-direction coverage at almost 7% can be considered for Intertop not a defeat, but a victory.
modnaKasta has noticeably dropped by the customer’s attendance among the market leaders – 36.6%. The second line is disputed by Lamoda (22.81%) and LeBoutique (23.53%), at that, LeBoutique inferring in the audience coverage in generally for the market, in the attendance it managed to bypass the competitor among the top-5.
Diagram: Audience reach (click on it to enlarge the picture)
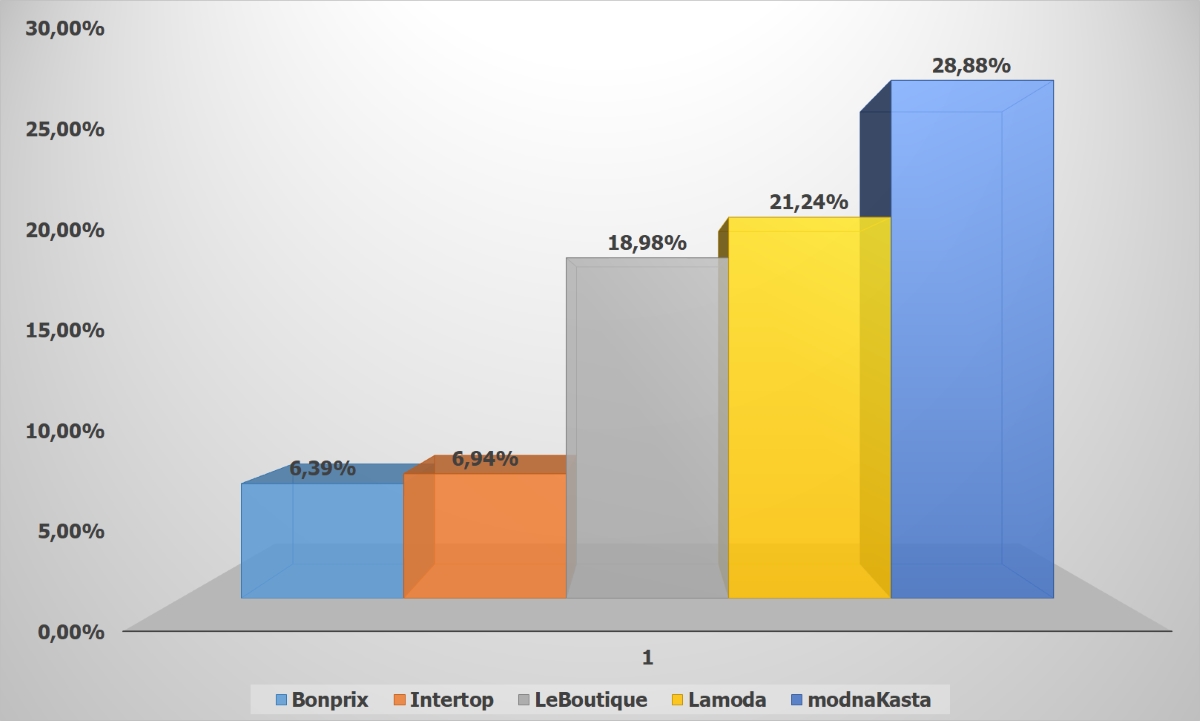 Diagram: Sites attendance by unique users (to enlarge the picture, click on it)
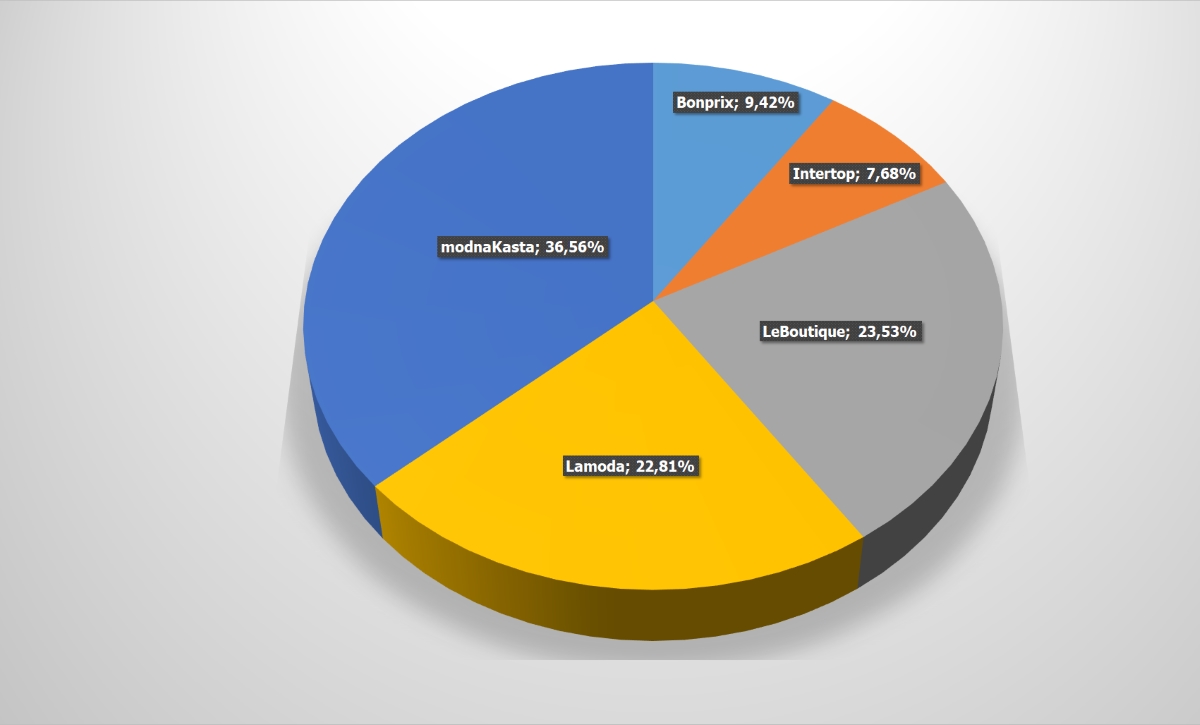 What is not typical: these segment clients are distinguished by their tastes stability. Users go to the retailer’s page again and again after once choosing one of the online-stores. Two-thirds of regular customers are an excellent indicator for the Ukrainian market. If, of course, visitors to the fashion companies portals really buy, and not just admire the models for sale.
Diagram: The unique and repetitive user’s ratio (to enlarge the picture, click on it)
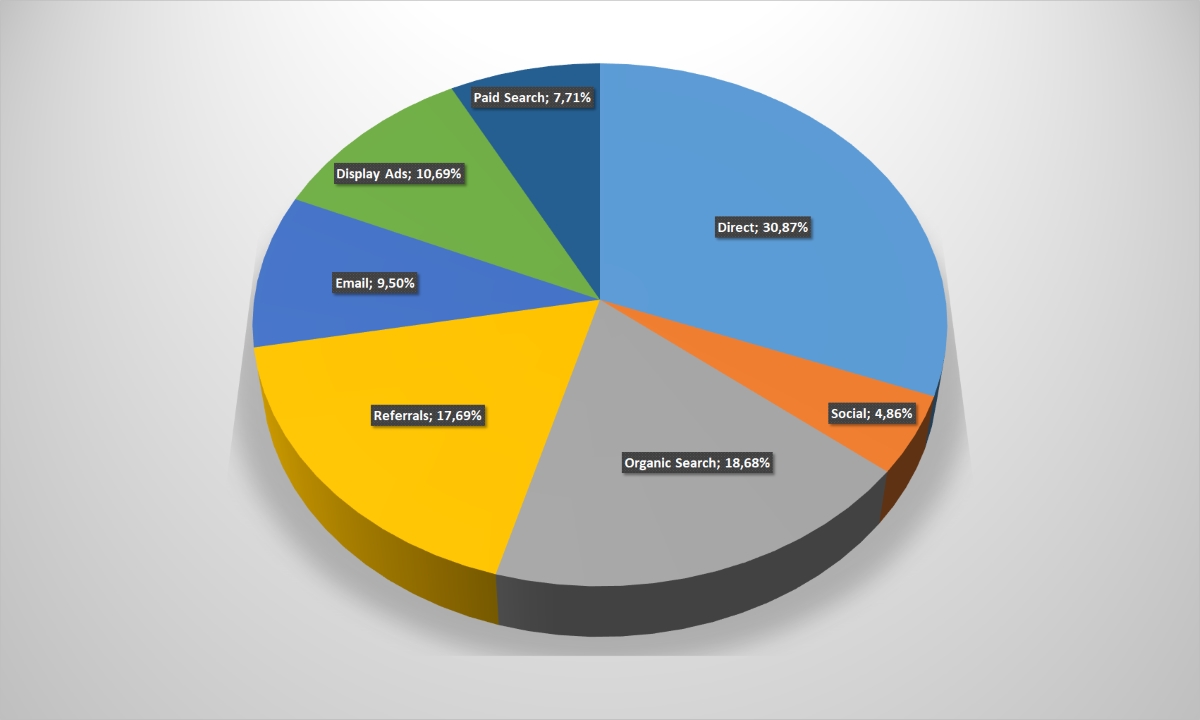
Traffic sources are non-standard for Fashion-operators. It has the highest percentage of calls from banner advertising from all categories – 10.7%! Good indicators are for e-mailings – 9.5%. Excellent indicators are for direct calls: a little less than a third of users do not look for information on the Internet, and immediately go to the favorite shops sites. The other side is the organic search sagging, but why it is needed, if customers know already where to find the necessary product?
Diagram: Traffic sources (click on it to enlarge the picture)
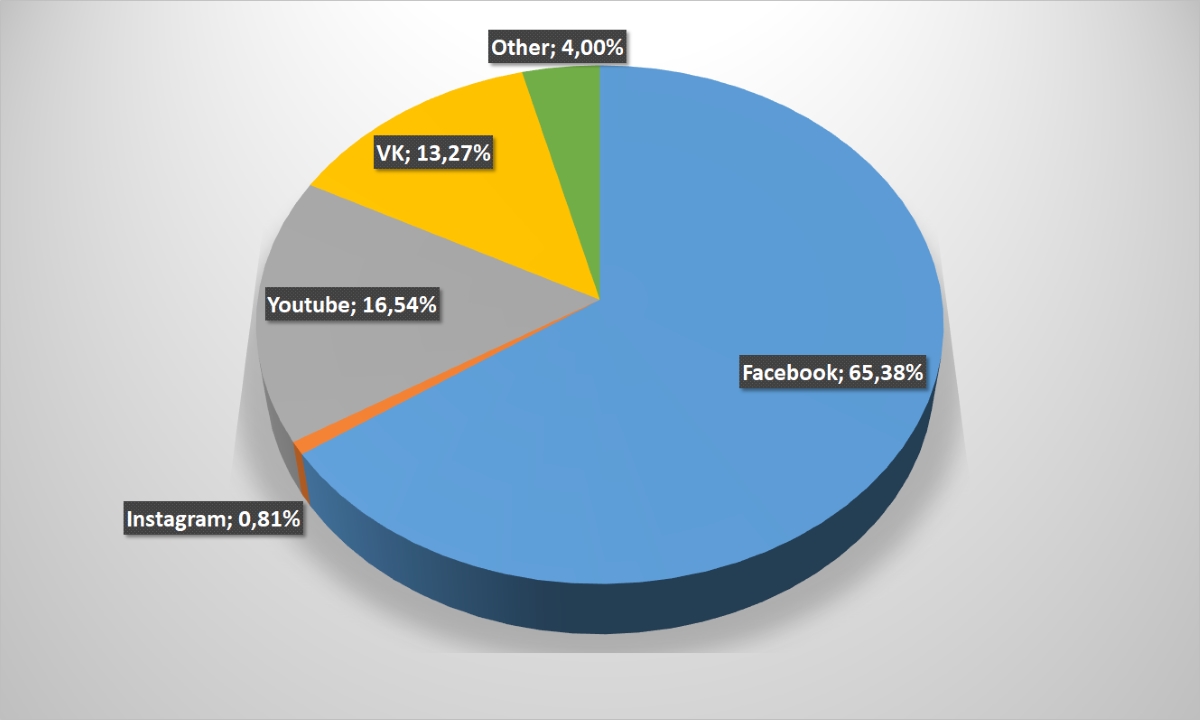
 It would seem that new collections video-reviews can also serve as a powerful means for the audience attention attracting. But in fact, Facebook is provided 65% of the traffic from social chains to fashionable retailers. Is this a consequence of constantly updated photo gallery, where the clothing models are represented in all angles sorts (although the percentage of transfers from Instagram is scanty), skillful investing in SMM-promotion or in something else – only businessmen and business-ladies know themselves.
Diagram: Transitions to the online-store site from social chains (click on it to enlarge the picture)
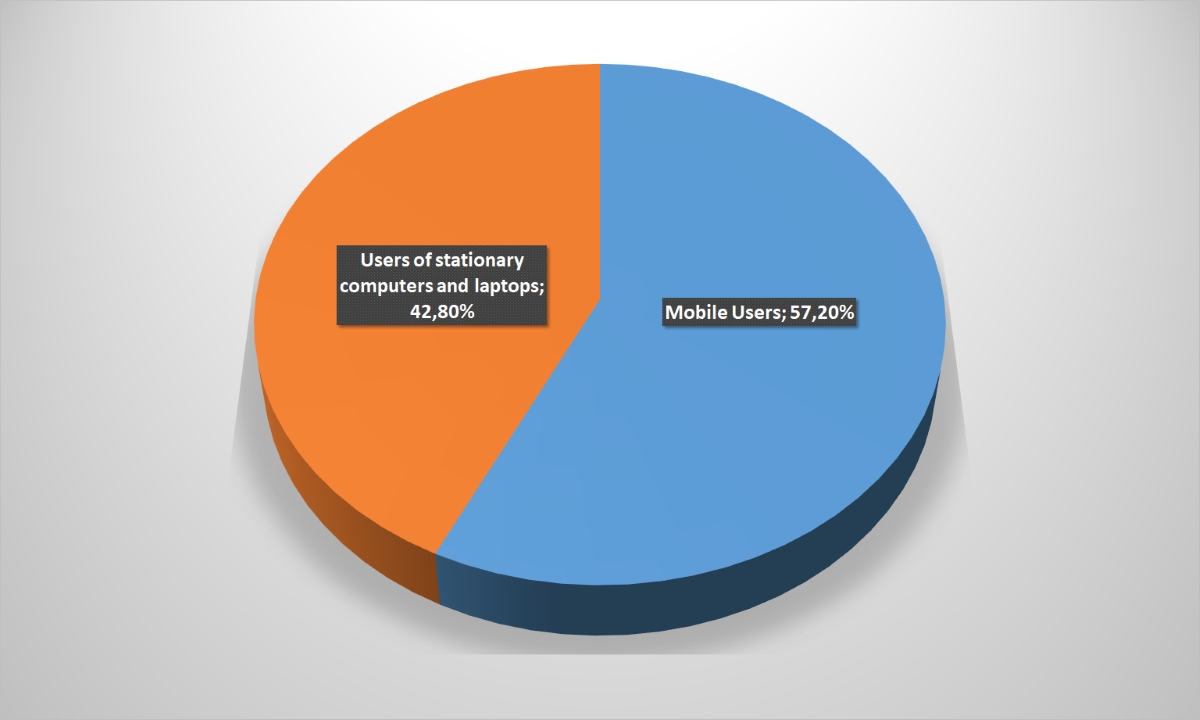
Than this segment differs sharply from the Ukrainian e-commerce other sectors: using devices. More than half – 57.2% of users – visit the online-store sites through PCs and laptops. Recall, that this percentage is 33.7 in general, for the sectors under study. The explanation is simple: since the customer’s vast majority of fashionable online-stores are women, many of them are looking for new outfit for lunchtime at the work – when there is an opportunity to slowly and carefully study the entire assortment, and choose liked goods. Not without reason, the average time spent by the user on the site and the view’s depth for fashion-retailers are the highest among the Ukrainian online-stores.
Diagram: Devices employed by users to access the Internet (click on it to enlarge the picture)

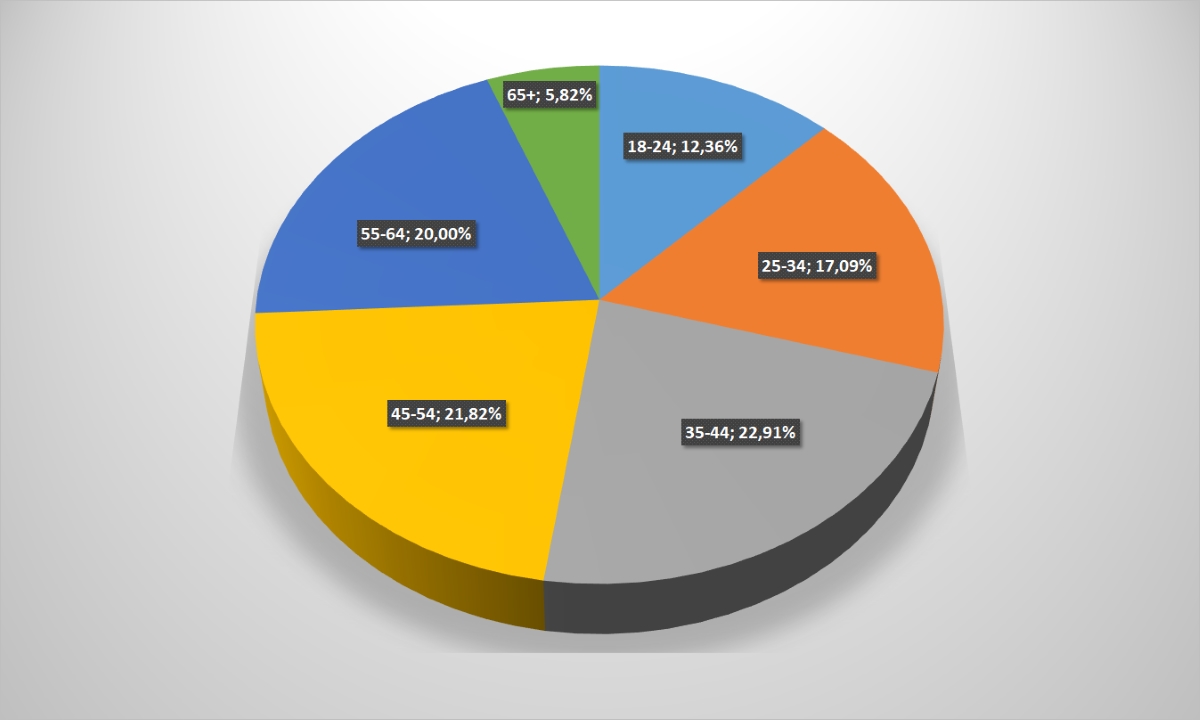
The humanity beautiful half representatives do not lose the habit of looking beautiful and dressing well at any age. Therefore, the visitor’s age cut to online- clothing-stores is quite diverse: no category has a clearly pronounced advantage. Retailers can only congratulate with this.
Diagram: User’s age category (to enlarge the picture, click on it)
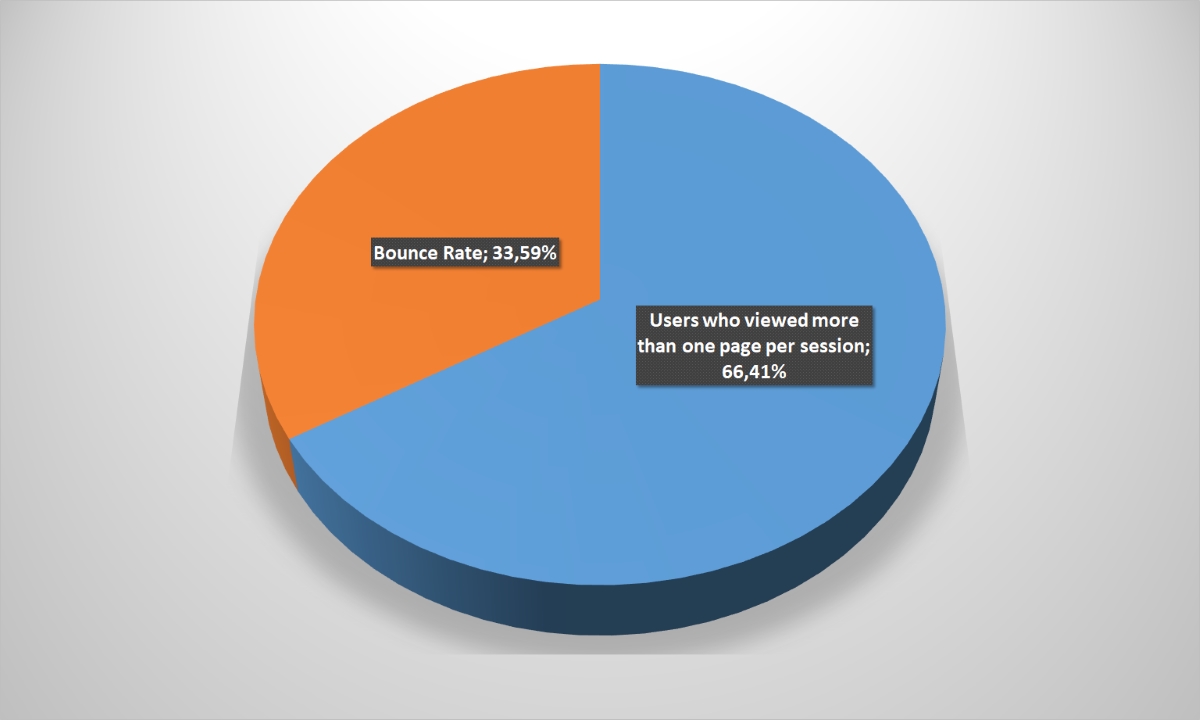
 33.6% failures rate should not surprise, considering the time that these portals users spend on sites selling clothes, unless it is as high as for this segment.
Diagram: Percentage of failures (to enlarge the picture, click on it)

Goods for sports are one of segments, which recorded the smallest breaks in the audience reach between the market leaders. In fairness, it should be noted that many companies that have won consumers sympathy (such as Nike, Puma, Adidas) do not have own online-stores in Ukraine, so it did not participate in the rating.
The distance between others is several times less than in the case of shops selling gadgets or online-supermarket, and it is 1-2%. In total, top-5 segment online-retailers cover summarily a little more than half of sports goods trade market through the World Wide Web – 57%. It is not being compared with indicators, for example, the “Technology for home” sector.
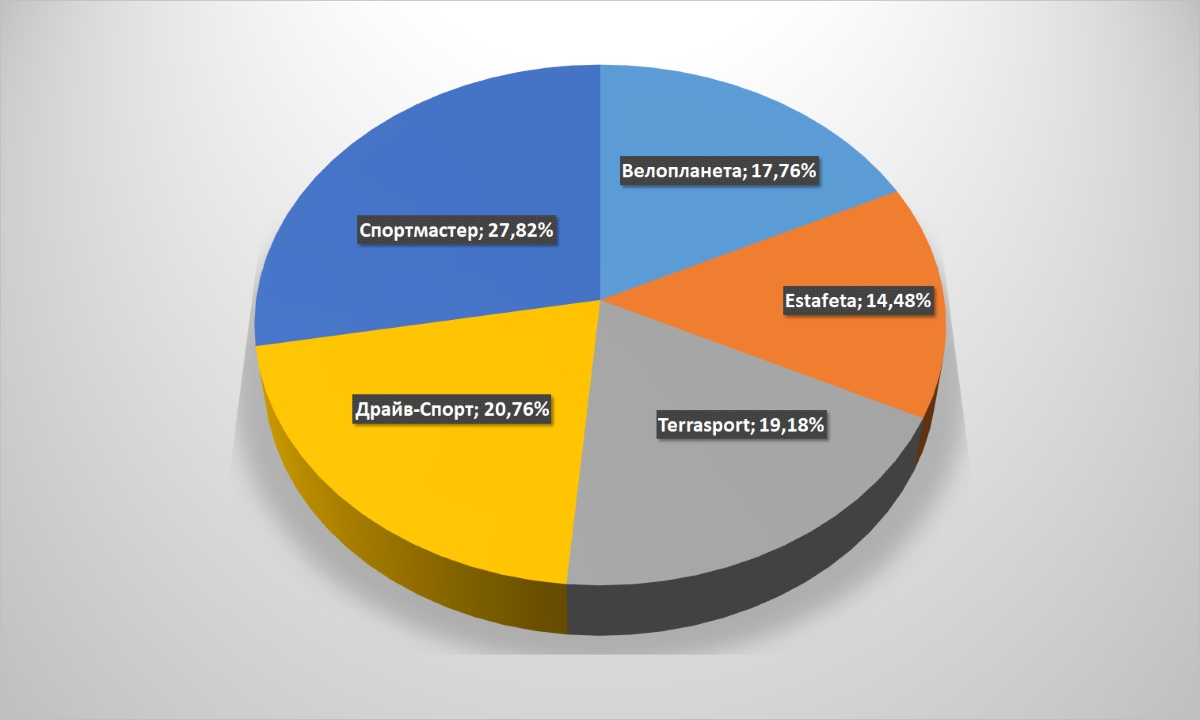
And the attendance within the top five distributed more or less evenly. The gap between the leaders Sportmaster was only 13.5% from the fifth-ranked Estafeta. Differences are striking with the situation in the “gadgets and accessories” segment, where Citrus scored more than 90%.
Diagram: Audience reach (click on it to enlarge the picture)
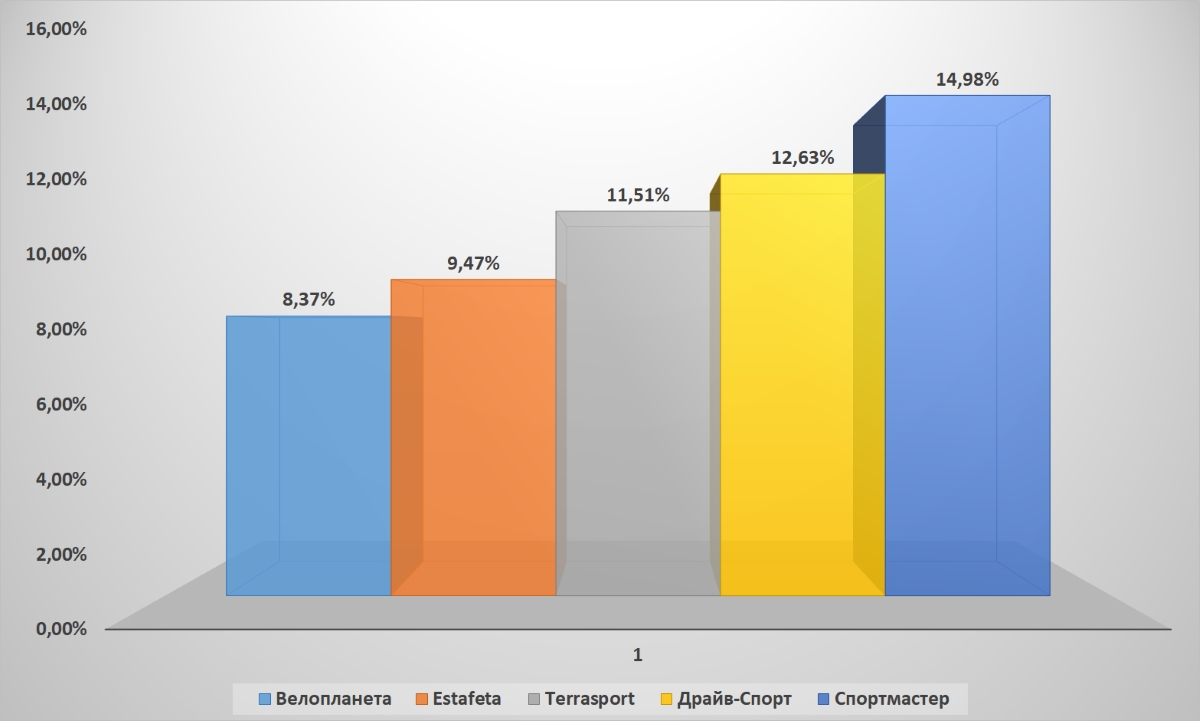 Diagram: Sites attendance by unique users (to enlarge the picture, click on it)
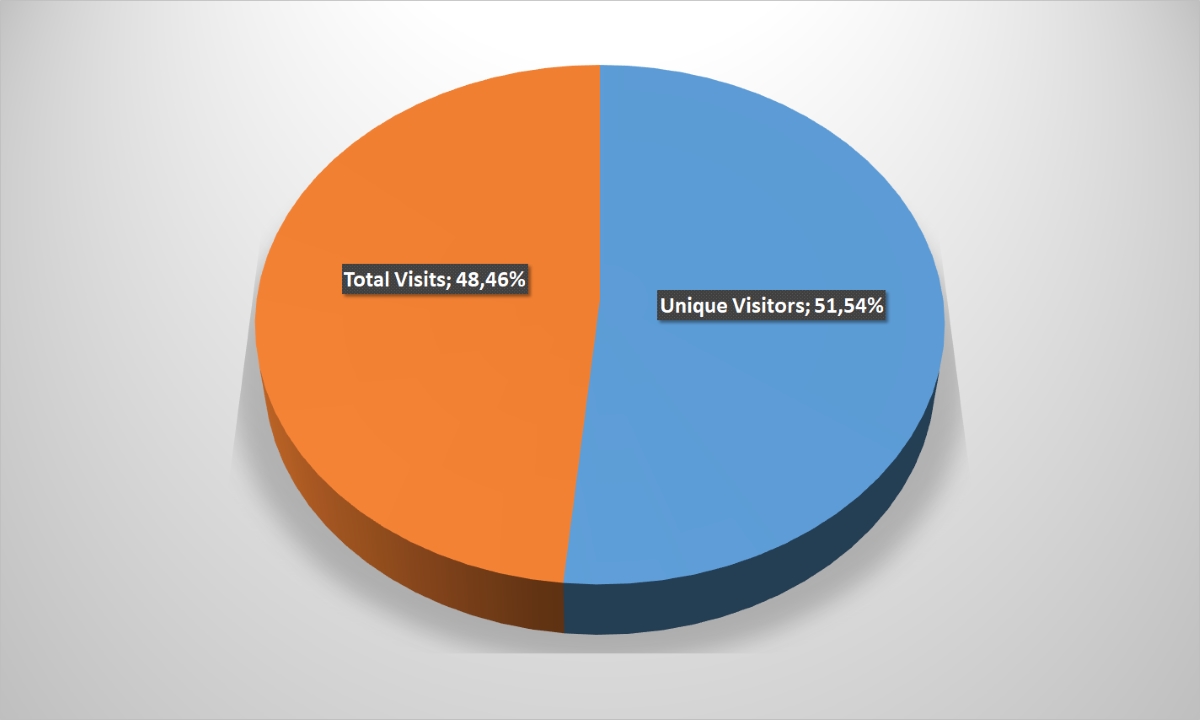
 Unique and repeated visits also do not differ much, which can be explained by the presence among sporting goods online-retailers of other strong players outside the top-5. That is, the consumer has the opportunity to choose where to buy this or those goods.
Diagram: The unique and repetitive user’s ratio (to enlarge the picture, click on it)
This also explains the fact that search chains (one of the highest indicator among all directions) and contextual advertising are brought slightly less than 60% of traffic to online-shop. Direct calls and attracting users from social chains are also at a good level. But e-mailings, banner and hyperlinks are inferior noticeably to average market indicators.
It can be concluded that most of sports goods store customers are beginning to look for a purchase, yet without a clear idea of where it will be made, and only a fifth of users first go to the particular company site.
Diagram: Traffic sources (click on it to enlarge the picture)
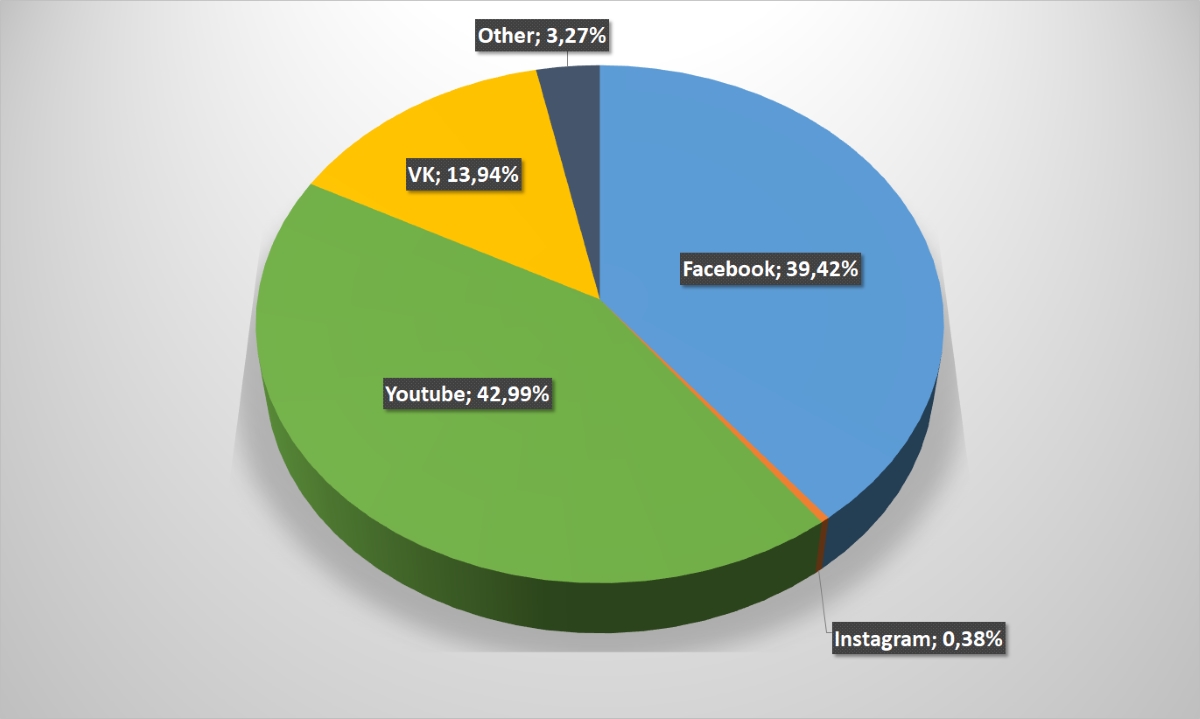
 Youtube brings a significant portion of potential buyers to sports equipment online-merchants as in the hardware stores case. On the other hand, Facebook is not much inferior to it. Almost 14% of the customer’s traffic from VKontakte is surprised, but this can be a residual phenomenon, gradually descending to zero – data for a full analysis is not enough.
Diagram: Transitions to the online-store site from social chains (click on it to enlarge the picture)
Buyers of goods for sports and outdoor activities are, naturally, young and energetic people. So 100% of online-stores customers are aged from 18 to 54 years in this direction.
It is quite logical that, according to the devices used type, smartphones and tablets are almost twice as large as PCs and laptops.
Diagram: Devices employed by users to access the Internet (click on it to enlarge the picture)
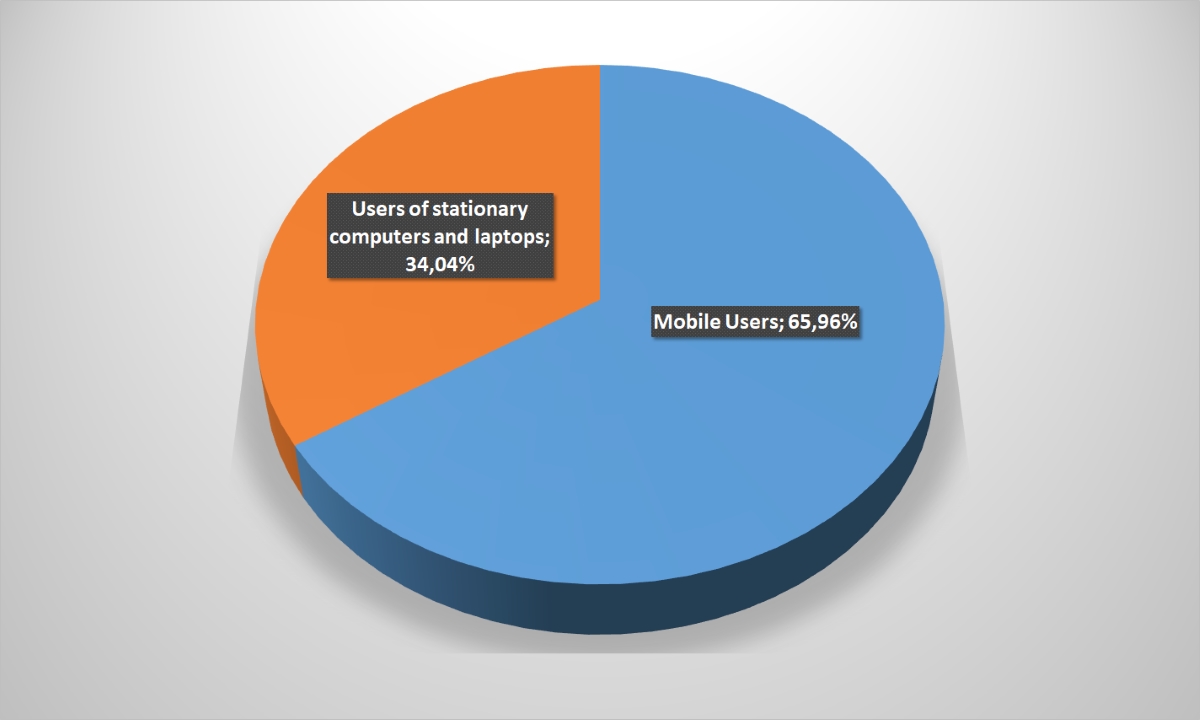
Diagram: User’s age category (to enlarge the picture, click on it)
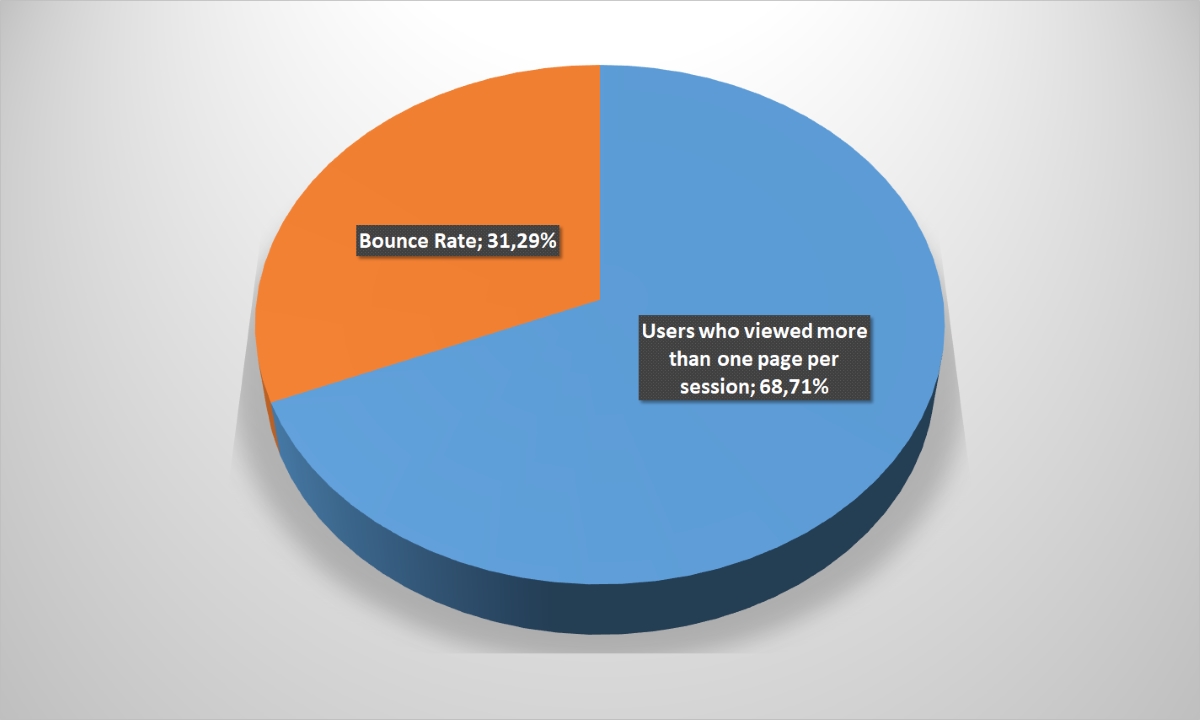
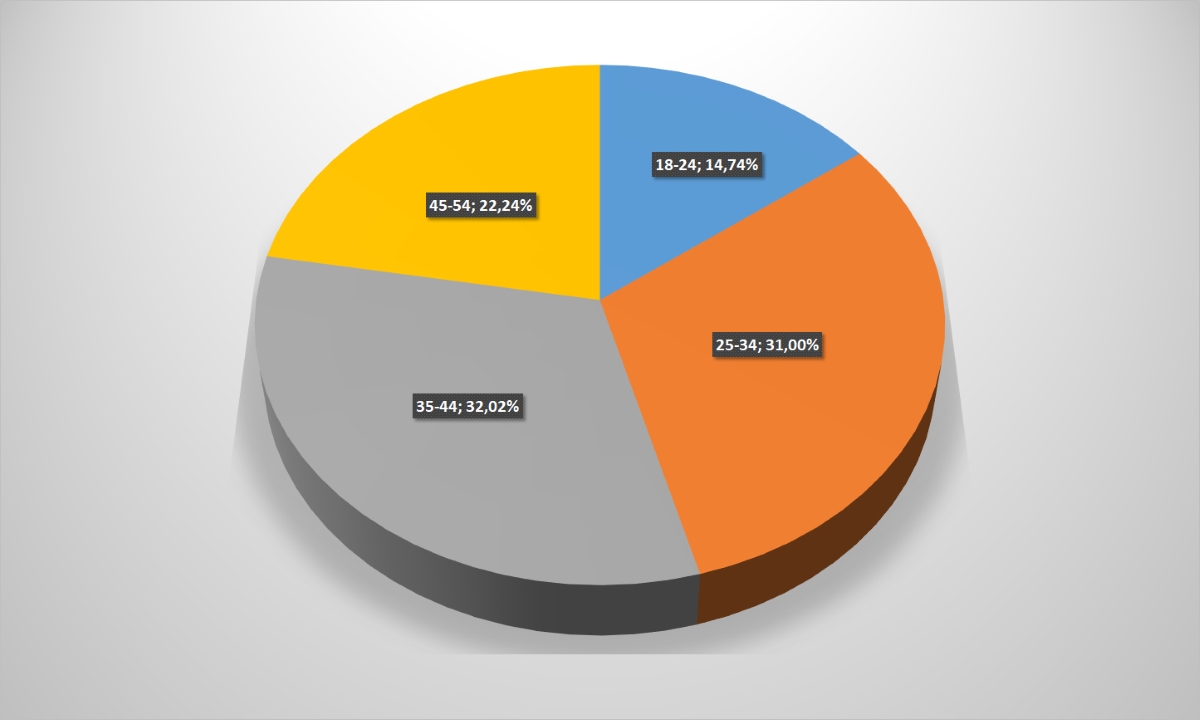 In addition, this consumer’s category is rather exacting to the offered products quality and as a rule considers several options before deciding to purchase. So 31% percentage of refusals is rather, partly erroneous visits or a visit to compare conditions in different stores.
Diagram: Percentage of failures (to enlarge the picture, click on it)

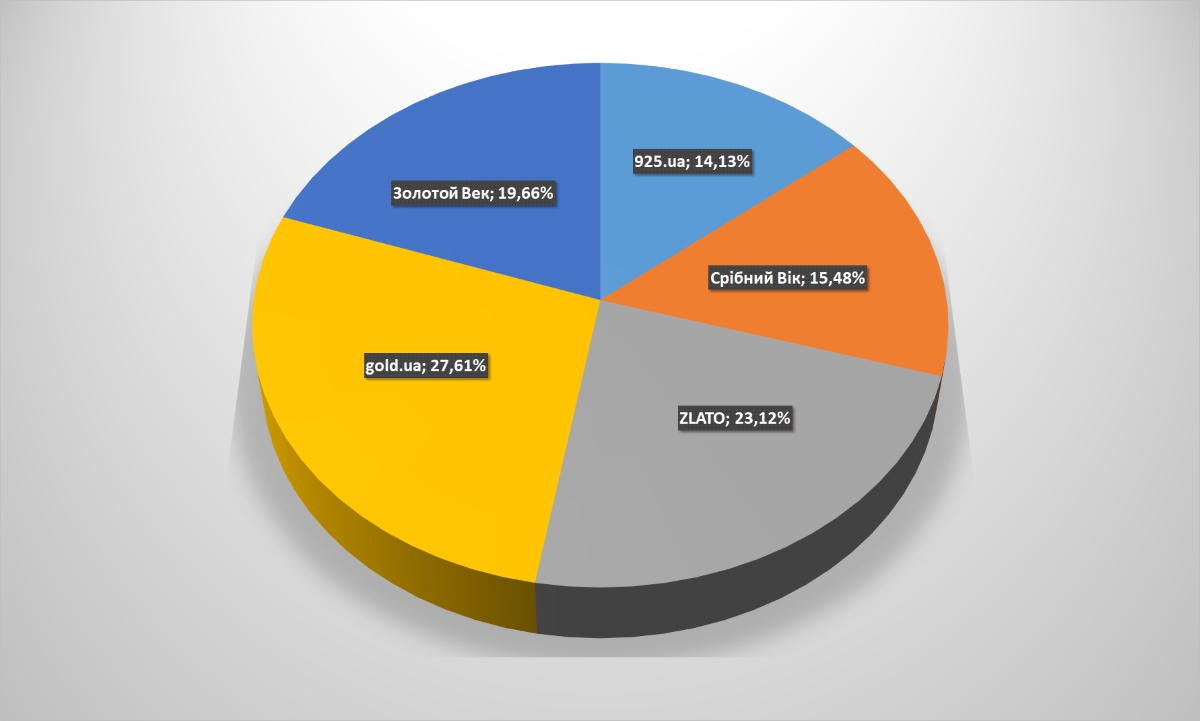
Again, the leader is obvious, albeit not as obvious as Rozetka or Citrus. The Golden Age is 8% ahead of its closest rival gold.ua on audience reach, and 10% ahead – zlato.ua. In all, the “Big Five” covers almost 79% of the Internet segment audience, which practically leaves no chance for other players.
But the high coverage and knowledge of the brand by consumers is not yet a high attendance and sales guarantee. The Golden Age is inferior on the attendance inside the top-5 gold.ua and zlato.ua with a noticeably higher audience coverage. It is not excluded that the reason is in the branched-out retail chain of the Golden Age brand: in an offline retailer it clearly over-rivals its competitors.
Diagram: Audience reach (click on it to enlarge the picture)
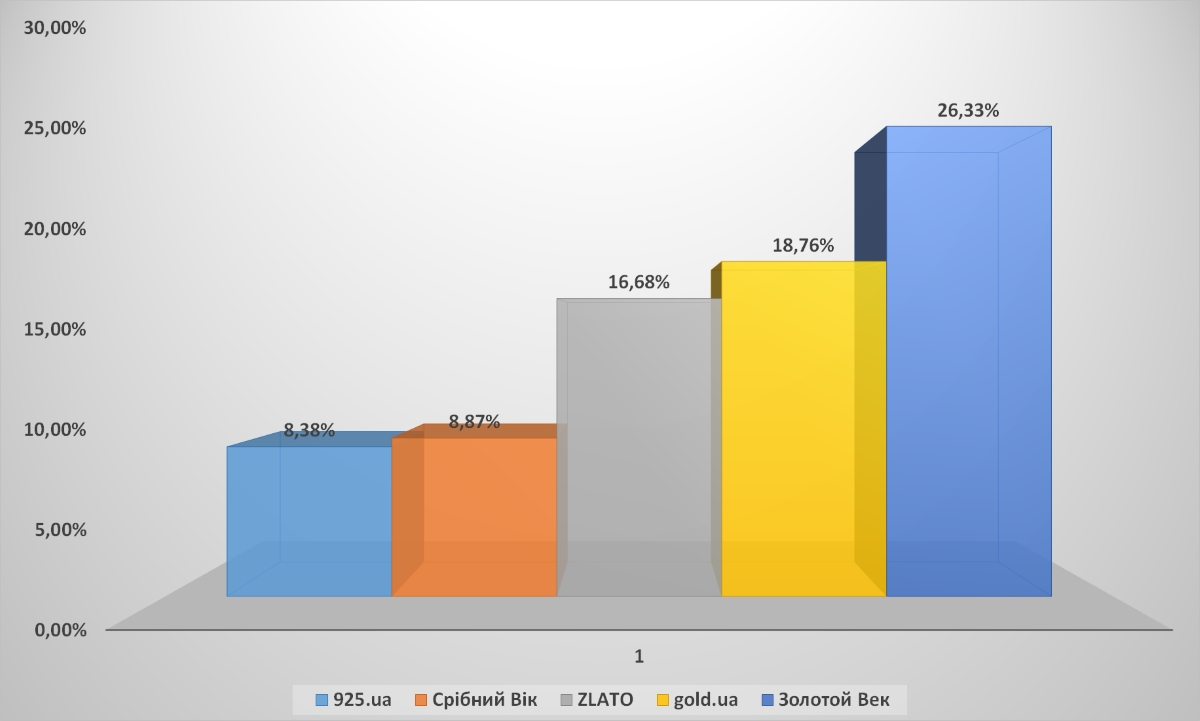 Diagram: Sites attendance by unique users (to enlarge the picture, click on it)
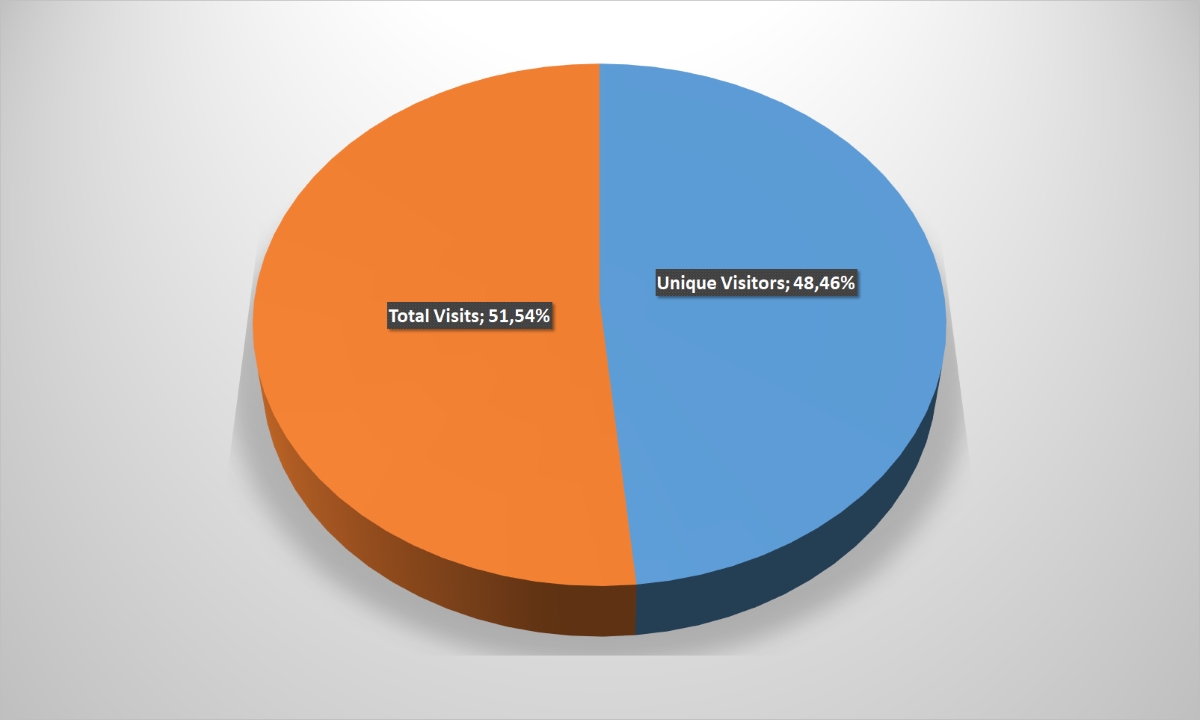
 The situation with unique and repeated visits is quite standard: in general, 50 to 50.
Diagram: The unique and repetitive user’s ratio (to enlarge the picture, click on it)
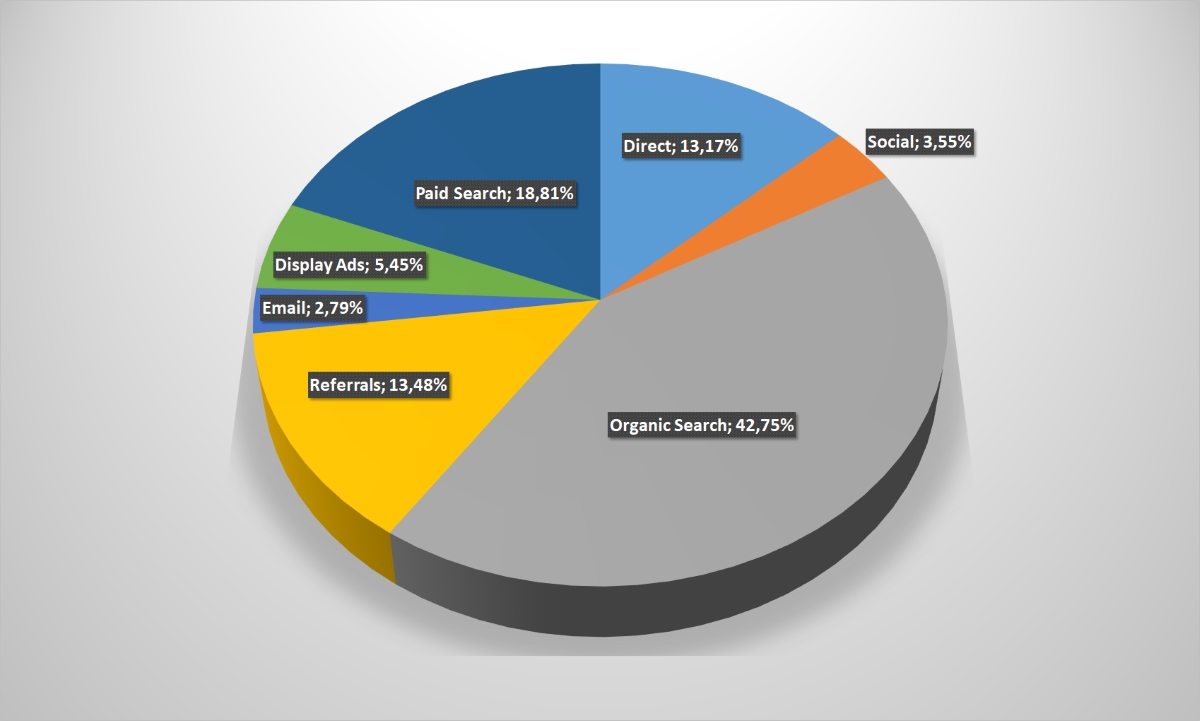
But the situation is closer to sports goods online-stores, according to traffic sources: the organic search and contextual advertising on keywords bring more than 60%. Direct calls are only 13%, referrals are a little more, and mailing and social chains in total give about 6% of calls. But the banner not bad work – above the average indicator for the industry. Again, we can state that users start with the good’s search, not yet deciding where they to buy it.
Diagram: Traffic sources (click on it to enlarge the picture)
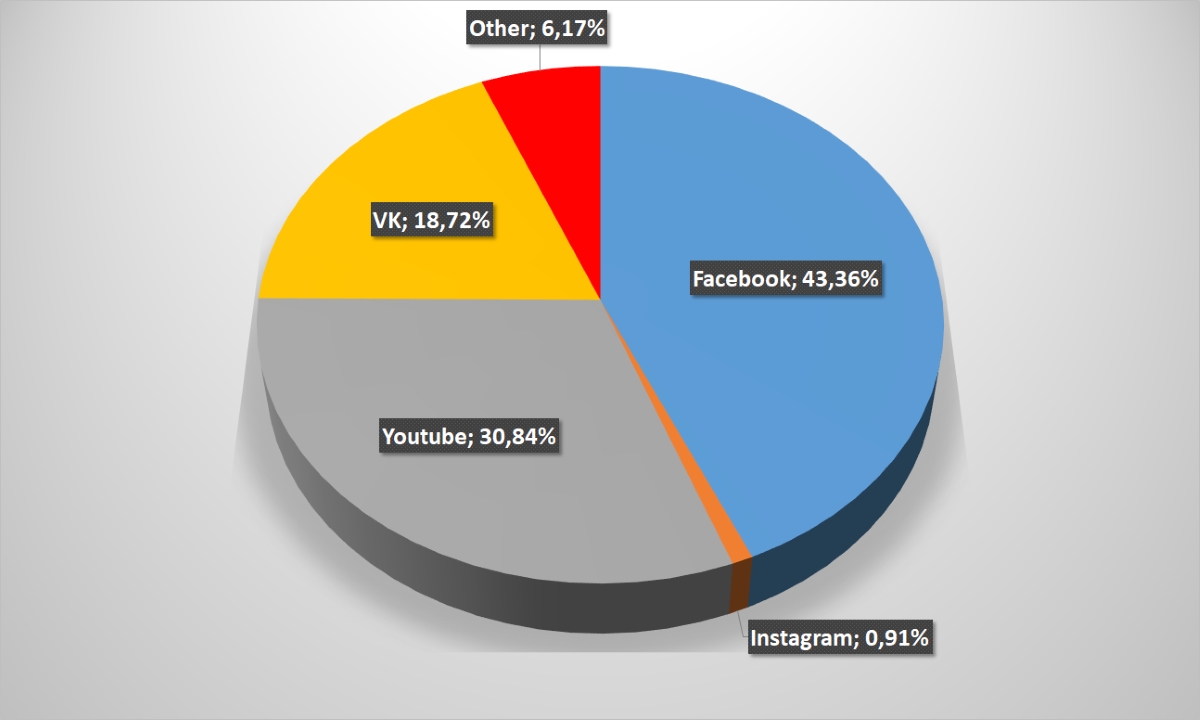
 We only note that Facebook and Youtube are again the leaders; as for itself, so Instagram demonstrated a good index, and VKontakte provided almost 19% of the transitions to jewelers’ websites, given the minor role of social chains in the general traffic generation of decoration online-stores. This is strange enough.
Diagram: Transitions to the online-store site from social chains (click on it to enlarge the picture)
It is interesting that the call indicators from mobile devices exceed by 10% average indicators for the market. There are doubts, however, that this leads to high conversion: it is possible that users only collect information before finally to order a product in an online-store or offline-outlet.
Diagram: Devices employed by users to access the Internet (click on it to enlarge the picture)
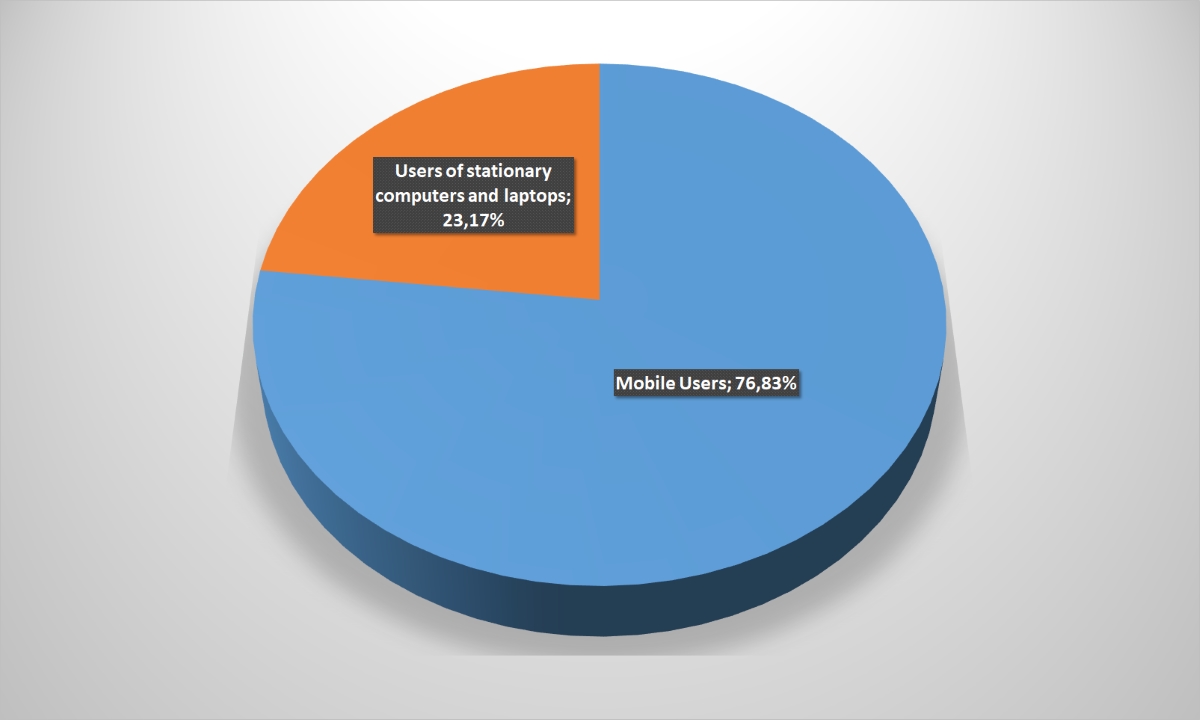
It is also worth noting that 70% of visitors to jewelry retailers’ websites are people under 45 years old. Obviously, the older generation prefers to choose jewelry “in the old fashion”: studying the presented goods in traditional stores. Well, or they refuses generally to buy jewelry.
Diagram: User’s age category (to enlarge the picture, click on it)
 In spite of this, the percentage of potential customers who stopped the acquaintance with online-stores on the first page is rather small – slightly more than 30. The majority remains on the site, or studying other offers, or already making out the purchase.
Diagram: Percentage of failures (to enlarge the picture, click on it)
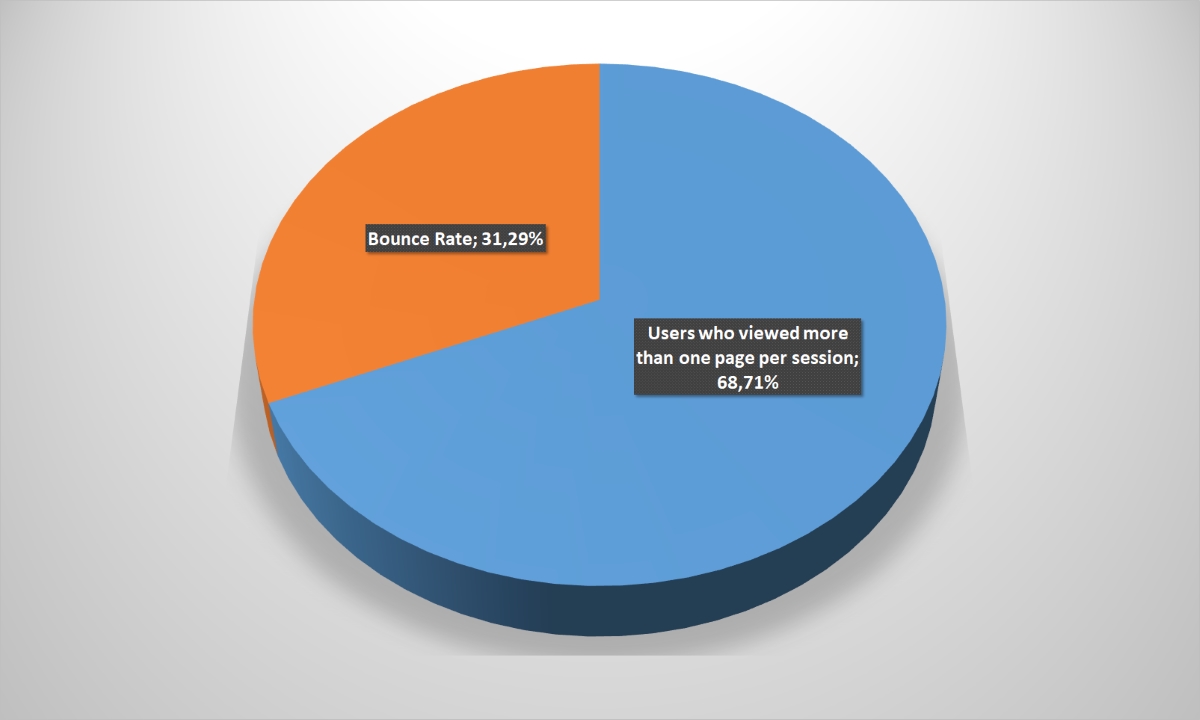

It is worth noting first of all that the BI-indicators – Budinok Іgrashok – not exactly meet the reality, analyzing indicators of children’s goods online-stores. Over the past year, the company rebranded and moved from the old site igrushki.ua to the new bi.ua. Statistics on the old retailer site is not available and the data of the new portal appears in the analytics, which explains the relatively low performance of one of the segment leaders.
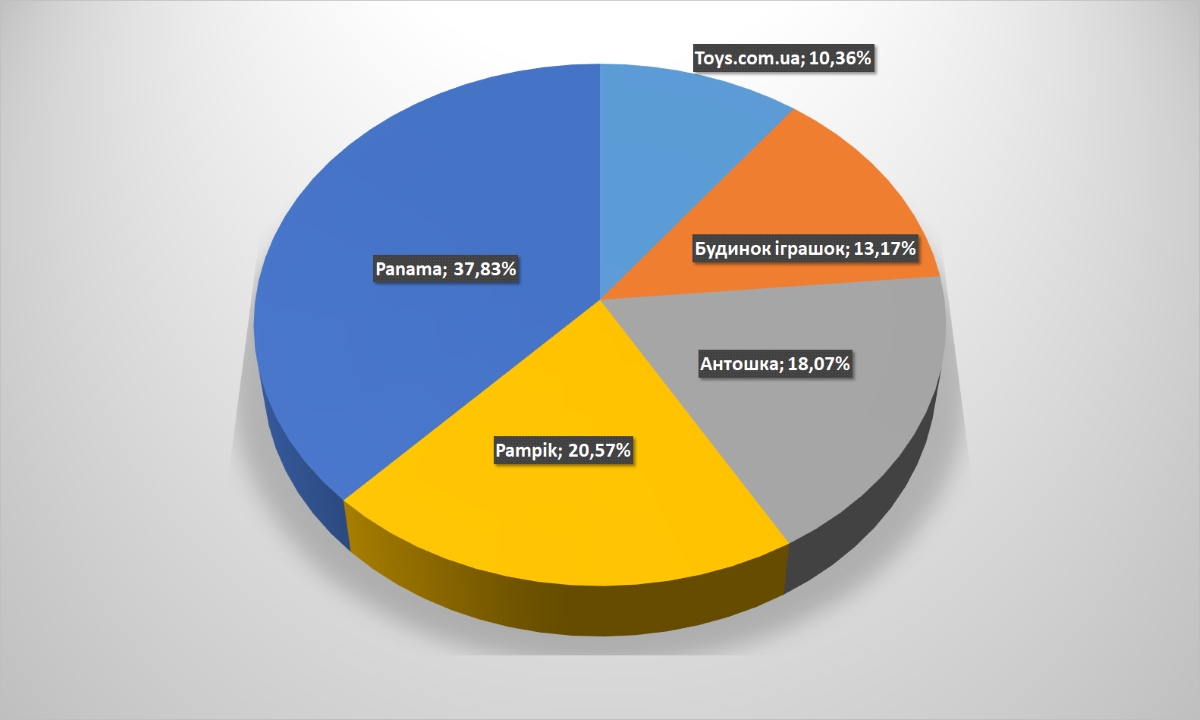
Panama online-store came off more than halved, alone covering a quarter of the UANet audience interested in goods for children, according to the actual data. It is an approximate equality among the remaining four including attendance among the top-five.
Diagram: Audience reach (click on it to enlarge the picture)
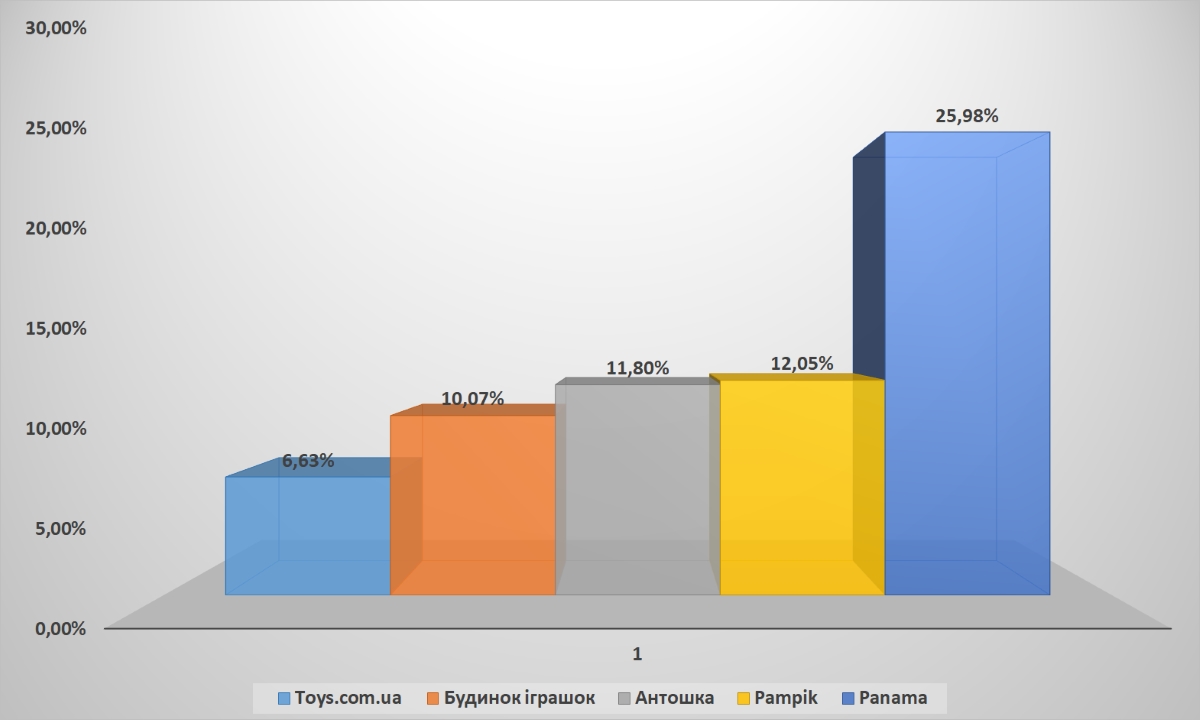 Diagram: Sites attendance by unique users (to enlarge the picture, click on it)
 As in some other cases, children’s retailers have a slightly better situation with repeated visits: most likely, once they have found a reliable store, the kid’s parents are not in a hurry to change their addictions.
Diagram: The unique and repetitive user’s ratio (to enlarge the picture, click on it)
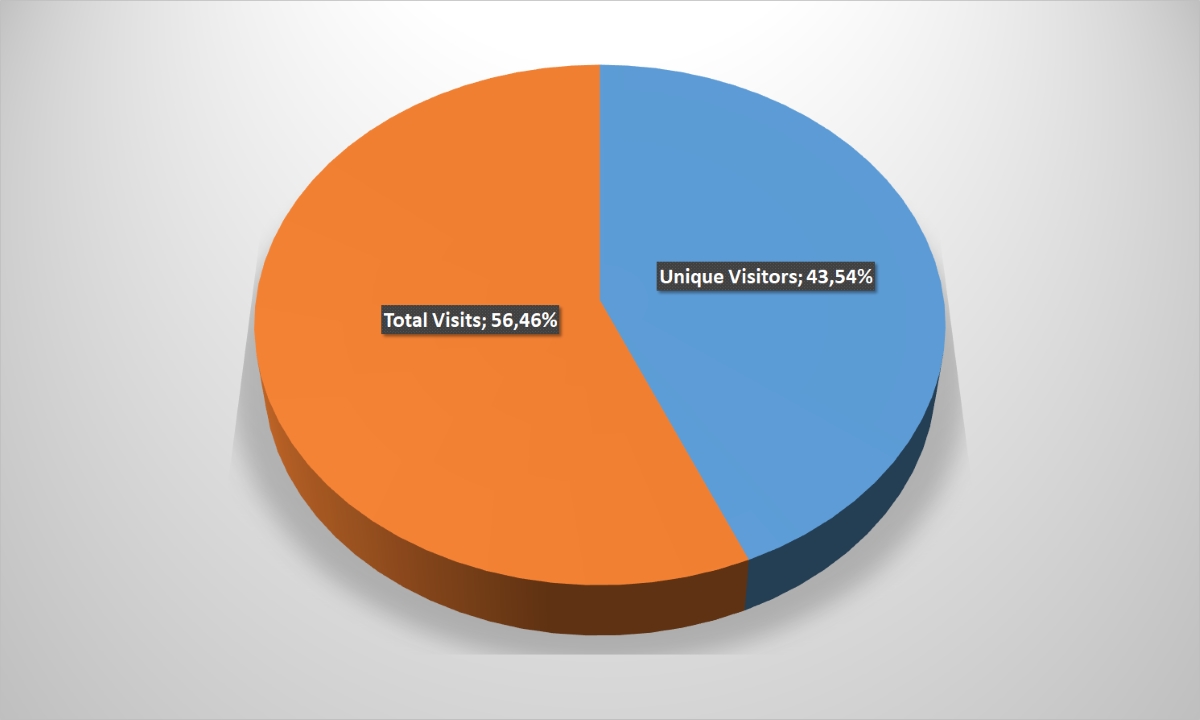
And again, the main traffic source for online-stores of products for children is search engines and contextual advertising, as with a number of previous categories. Direct incomes indicator is one of the lowest in the Ukrainian e-commerce, and it is also much less possible to attract users through other “entry points”: mailings, social chains, banner and hyperlinks.
Diagram: Traffic sources (click on it to enlarge the picture)
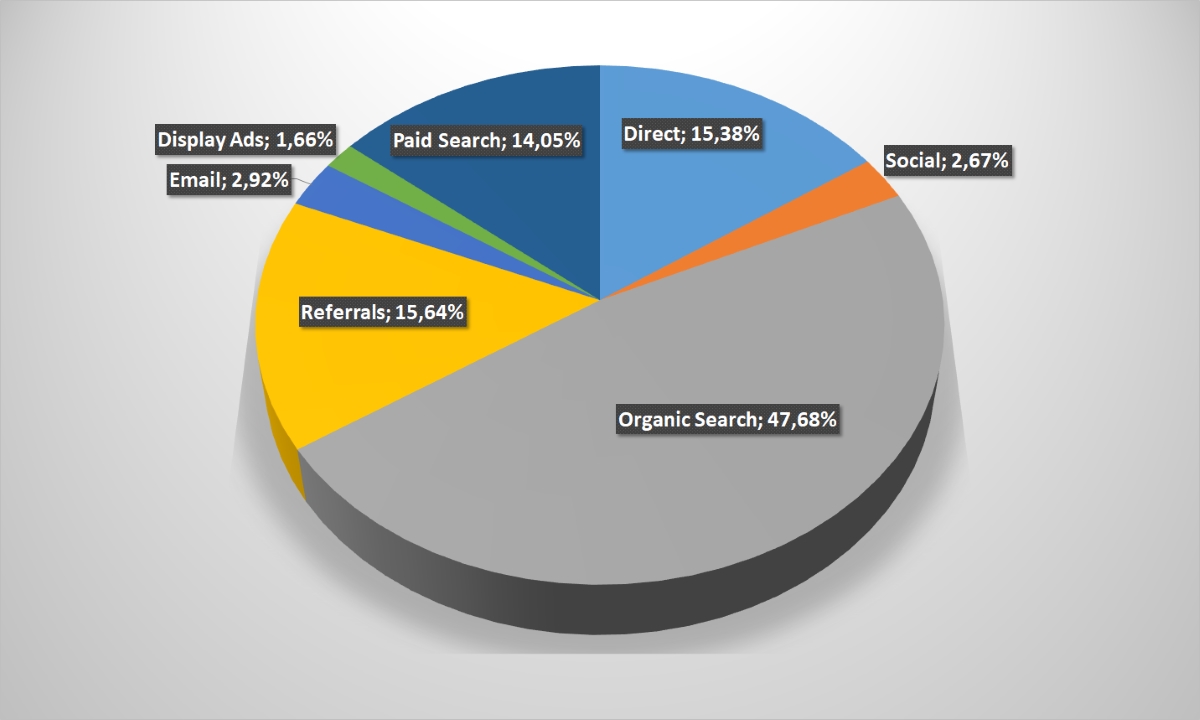 But Facebook provides half from 2.67% of the total traffic entering the online-platform of the children’s goods Ukrainian sellers. That is not peculiar, in general, for the domestic e-commerce. Youtube has the second place, and VKontakte has the third one again, though, with a noticeably lower index than jewelry stores.
Diagram: Transitions to the online-store site from social chains (click on it to enlarge the picture)
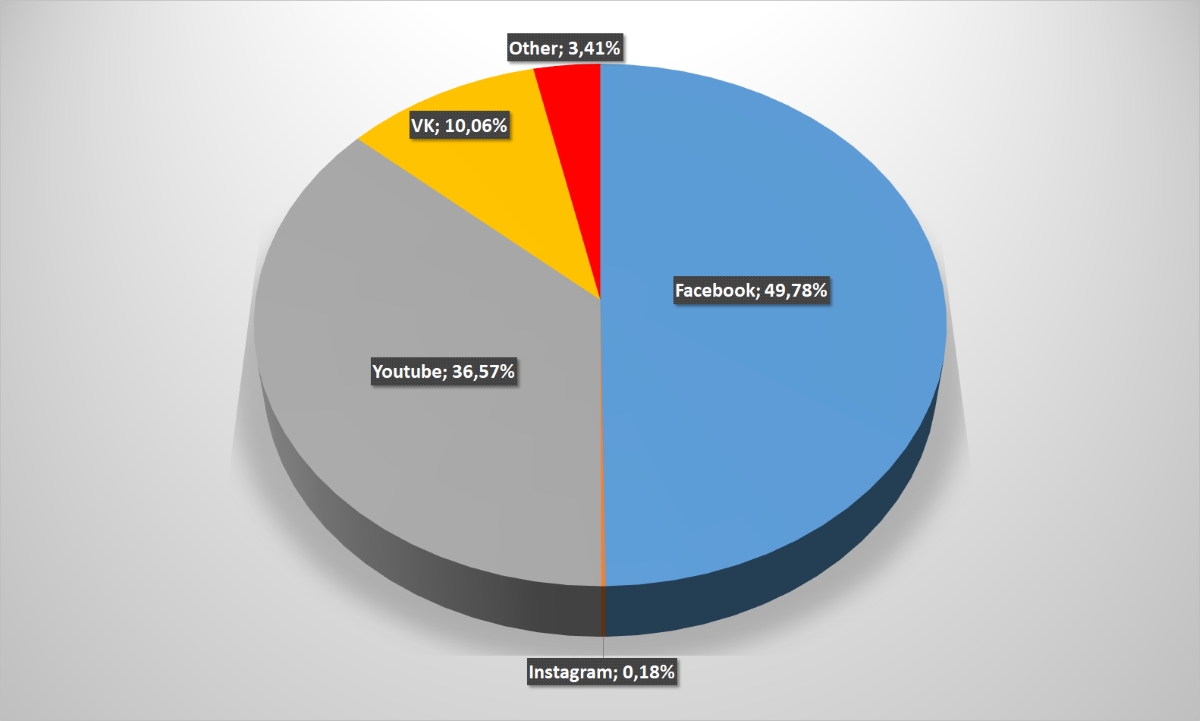
Goods for children buyers are sufficiently advanced technologically people. Such a conclusion can be made on the basis of one of the highest percentage among all sectors of calls from mobile devices – 72%.
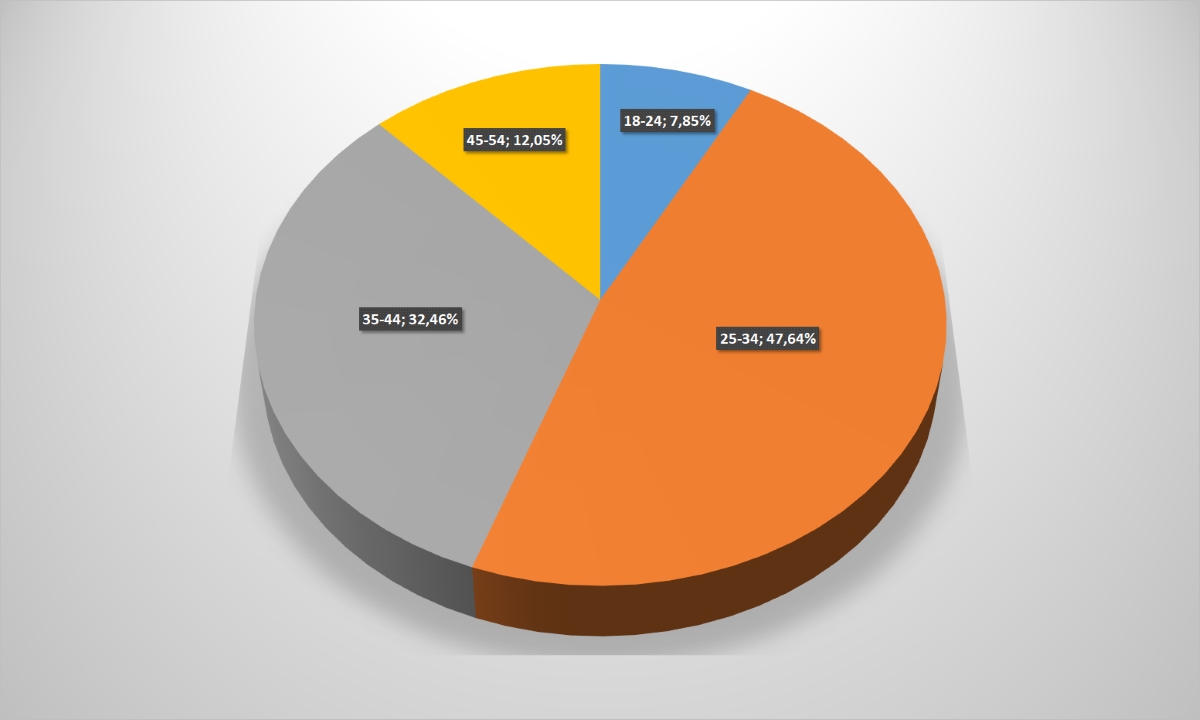
What is absolutely not surprising: 88% of users interested in purchasing children’s products are people under 44 years. And the overwhelming majority – 80% – is generally in the category most desired for the retailer and paying customers: from 25 to 44 years.
Diagram: Devices employed by users to access the Internet (click on it to enlarge the picture)
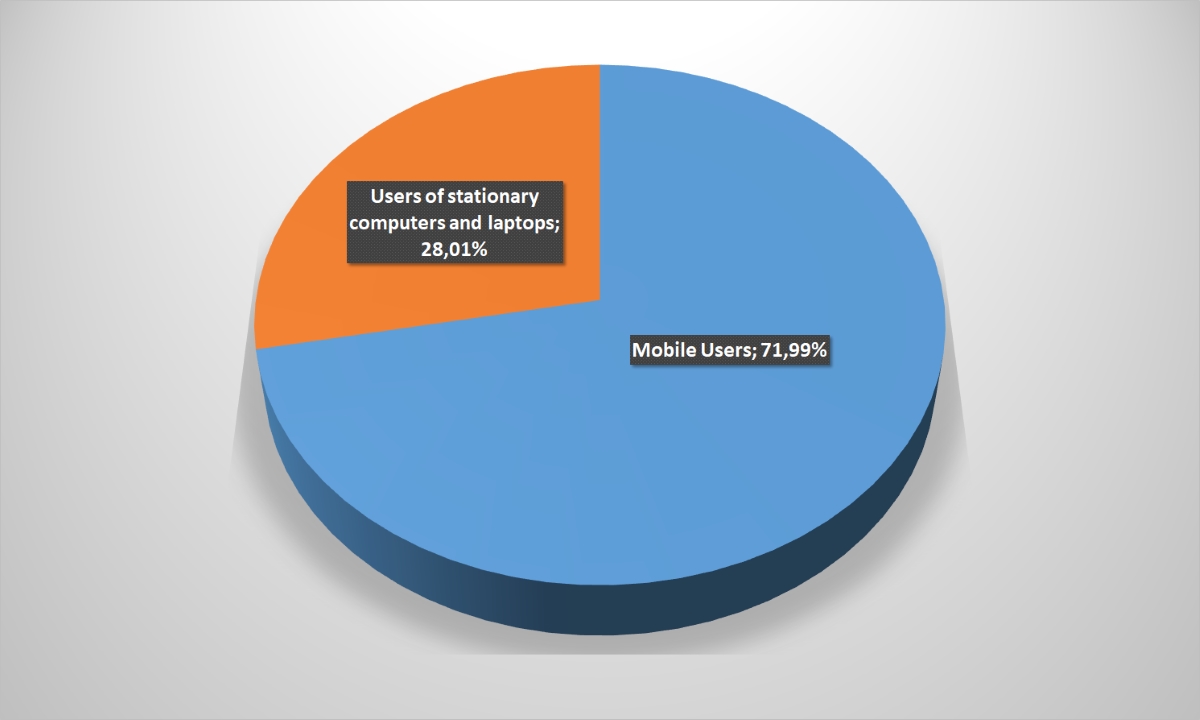
Diagram: User’s age category (to enlarge the picture, click on it)
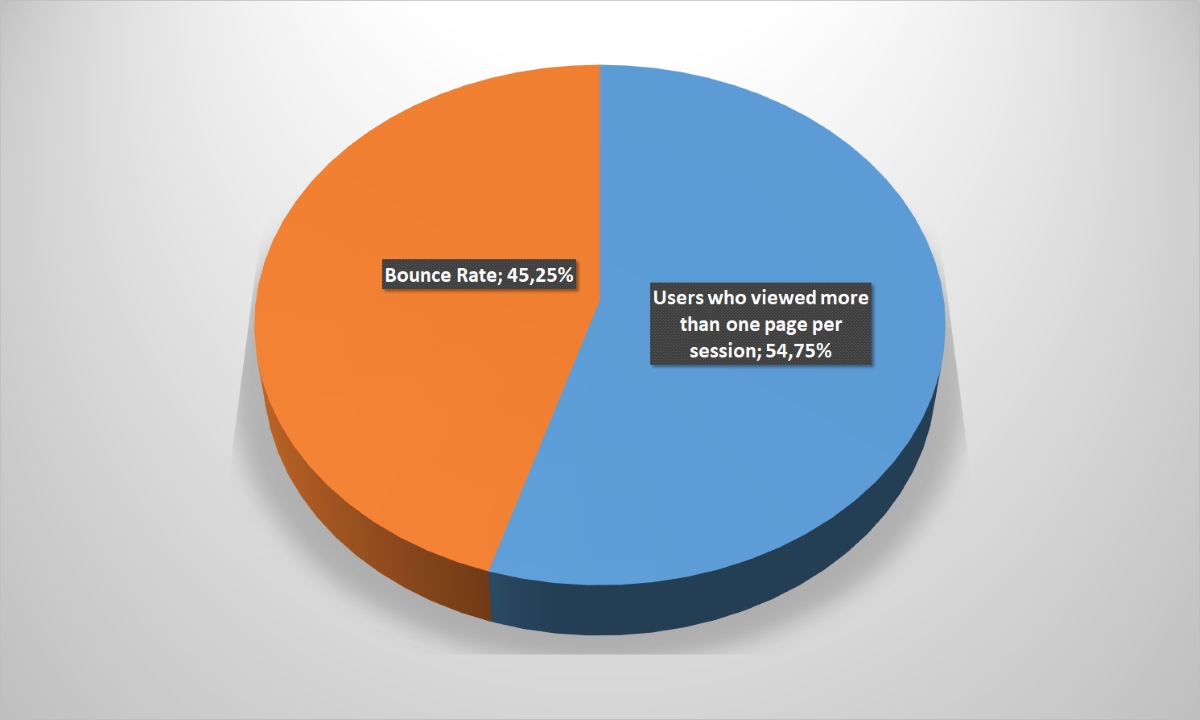
 But unusually many visitors to online-stores very quickly leave the portal: 45.25%. The additional possibility for online-traders lies here in order to keep potential customers and increase the conversion. If, of course, it will be possible to analyze users and find out the reasons for this behavior.
Diagram: Percentage of failures (to enlarge the picture, click on it)

The sphere of online-trade in cosmetics, perfumes and drogerie is in our report the eighth in a row, but not in importance. And here, too, the online-store MakeUp, alone controls the audience reach for half of this segment is an obvious leader. In total, the first five stores provide 85% coverage of the Ukrainians target audience.
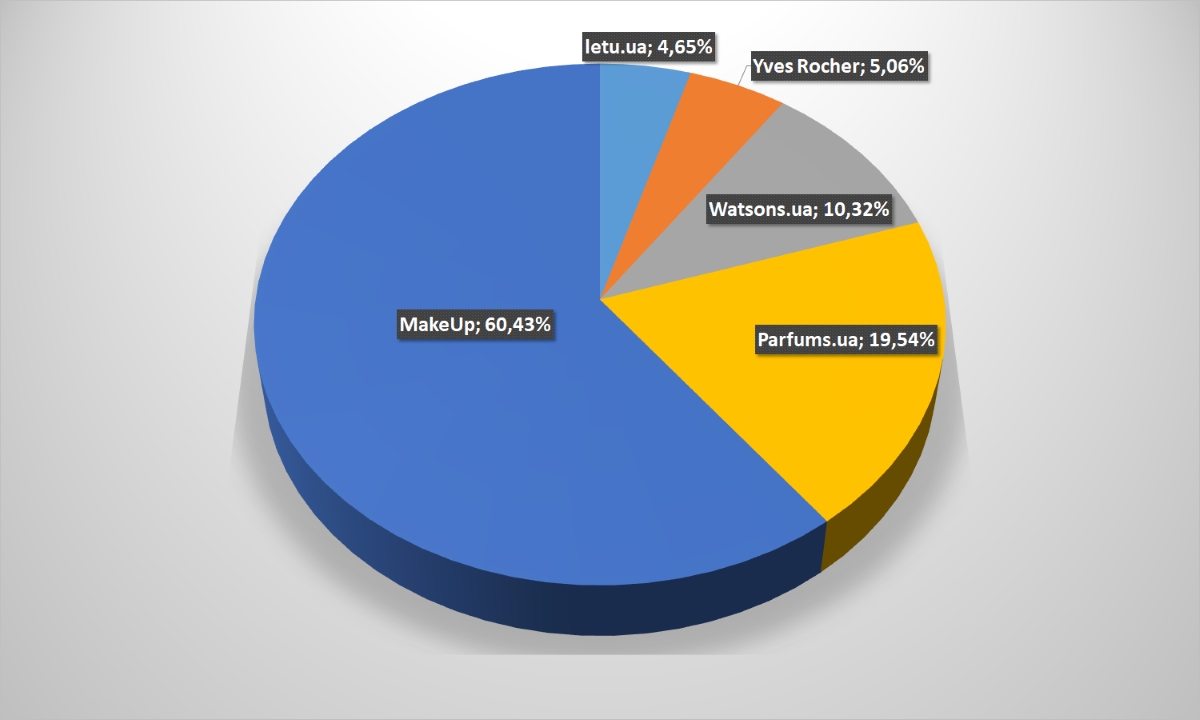
A similar situation exists within the top-5: MakeUp gets 60% of unique user hits, 3 times behind parfums.ua, in 6 times – not so long ago started watsons.ua.
Diagram: Audience reach (click on it to enlarge the picture)
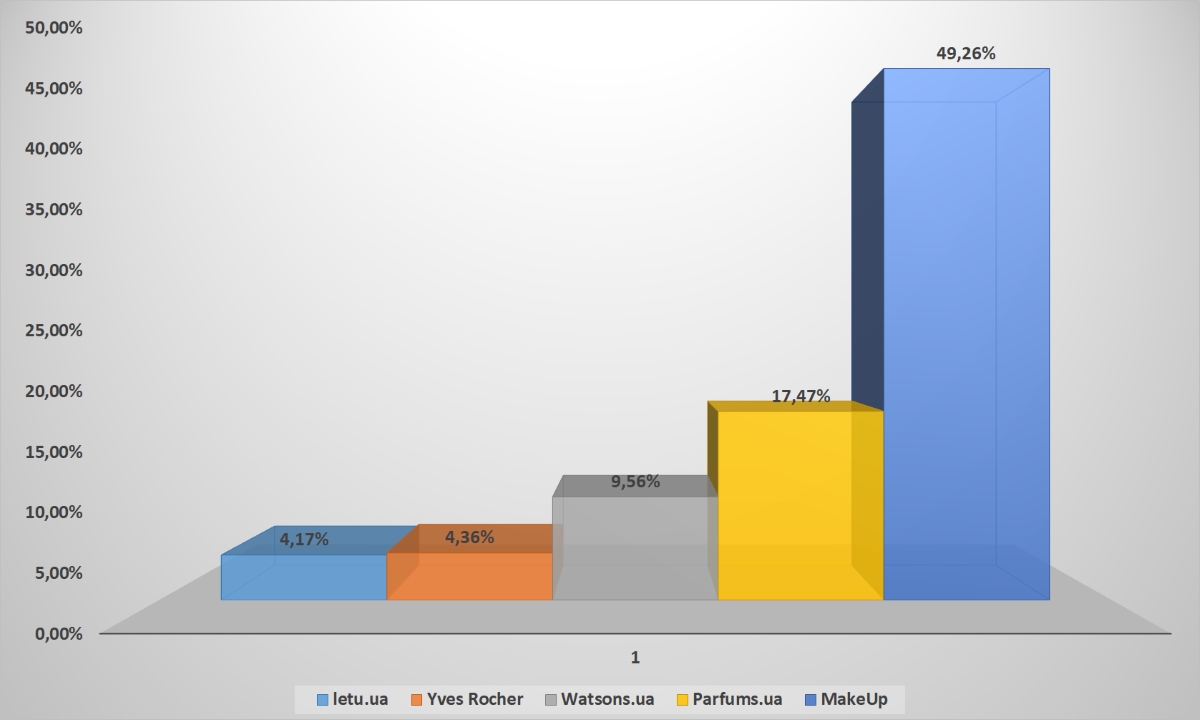 Diagram: Sites attendance by unique users (to enlarge the picture, click on it)
 And buyers of cosmetics are one of the most stable and grateful target audiences for online-retailers. Almost two thirds of them return to shopping for industry leaders.
Diagram: The unique and repetitive user’s ratio (to enlarge the picture, click on it)
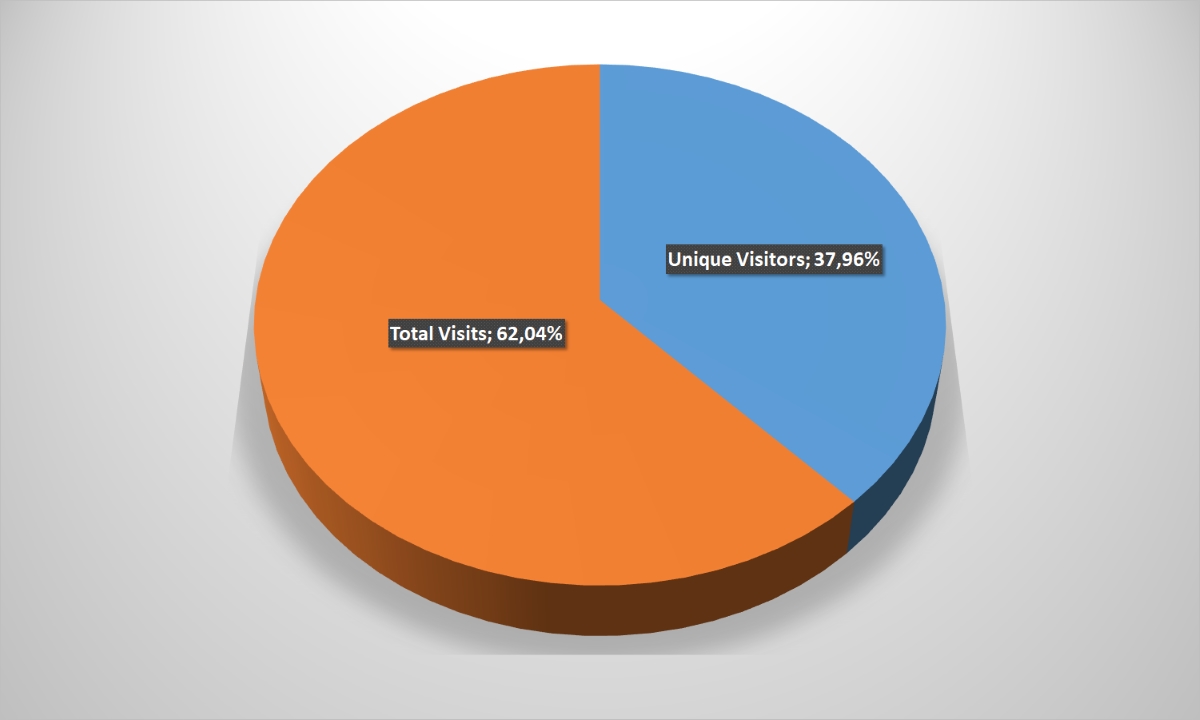
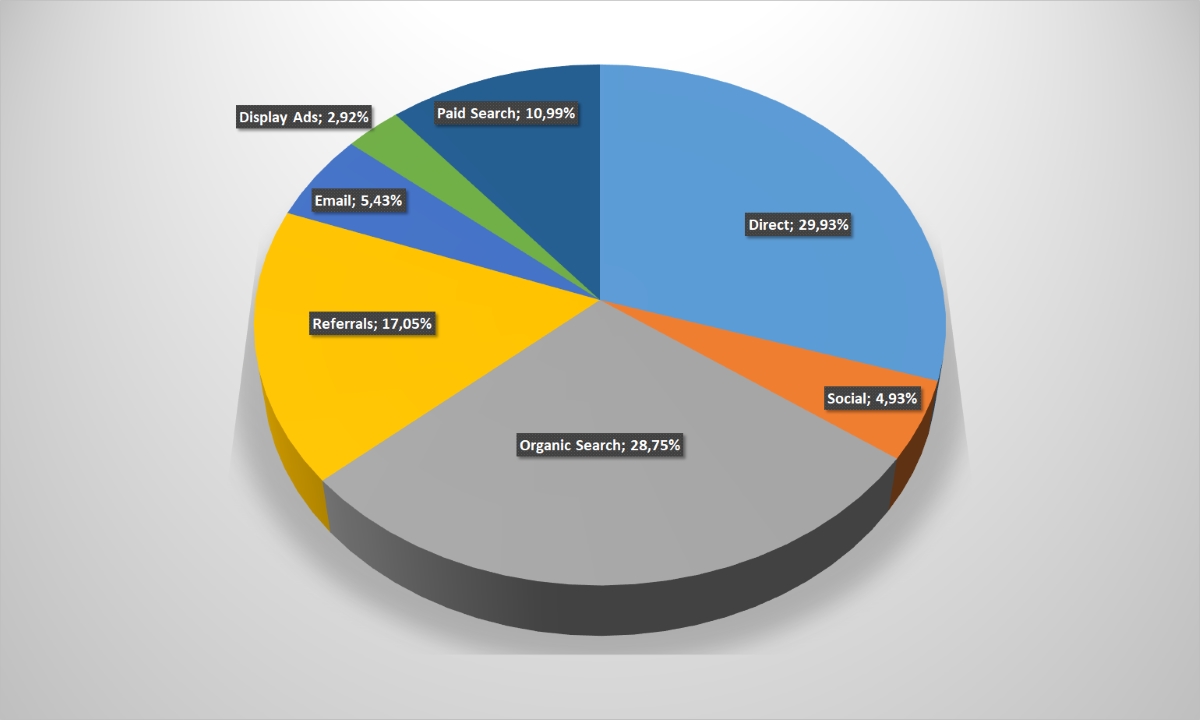
Stability is confirmed by the traffic sources analysis. Direct calls to online-stores websites account for over 30%, despite the fact that this figure is only 19% on the average in the Ukrainian e-commerce market. E-mailing is also very effective, but search queries are inferior to average indicators: it is possible that users prefer to search for goods not just on the World Wide Web, but on the particular company site. It’s not for nothing that the “Cosmetics and drogerie” segment confidently takes second place both in time spent on the site and in the view depth.
Diagram: Traffic sources (click on it to enlarge the picture)
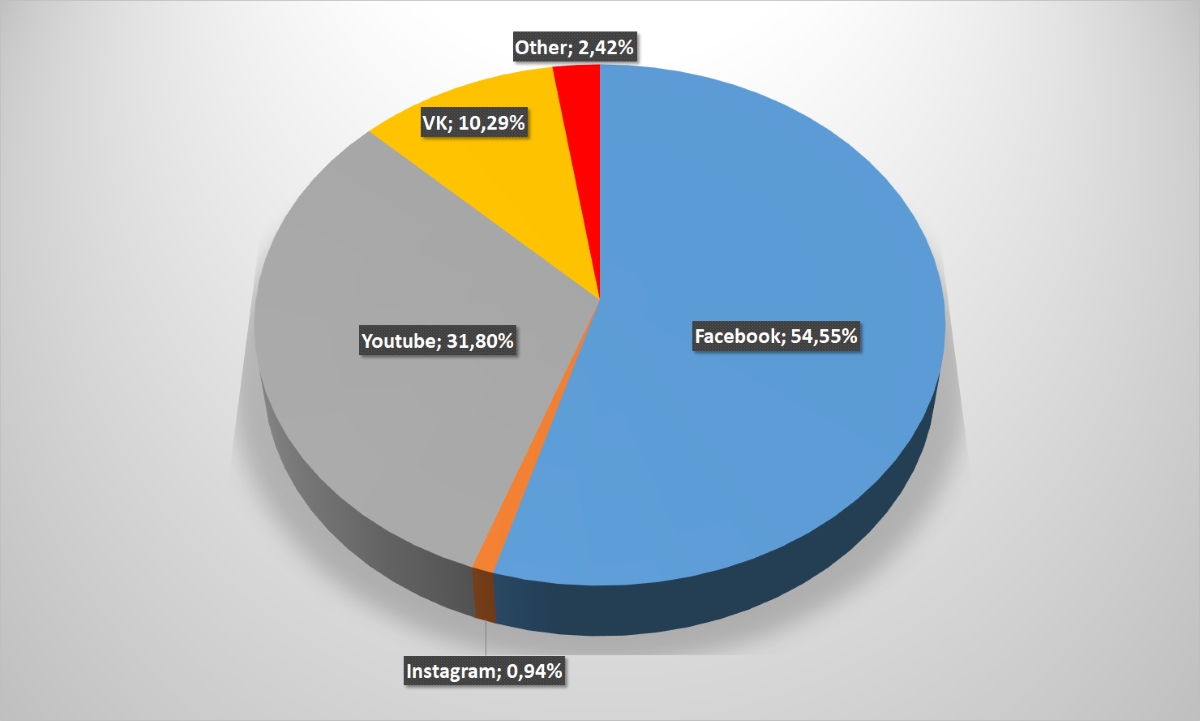
 The most popular chain among buyers of products this category is Facebook. And that its advantages over Youtube were not so significant in other segment. Other social chains, except for VKontakte, as usual are within the statistical error.
Diagram: Transitions to the online-store site from social chains (click on it to enlarge the picture)
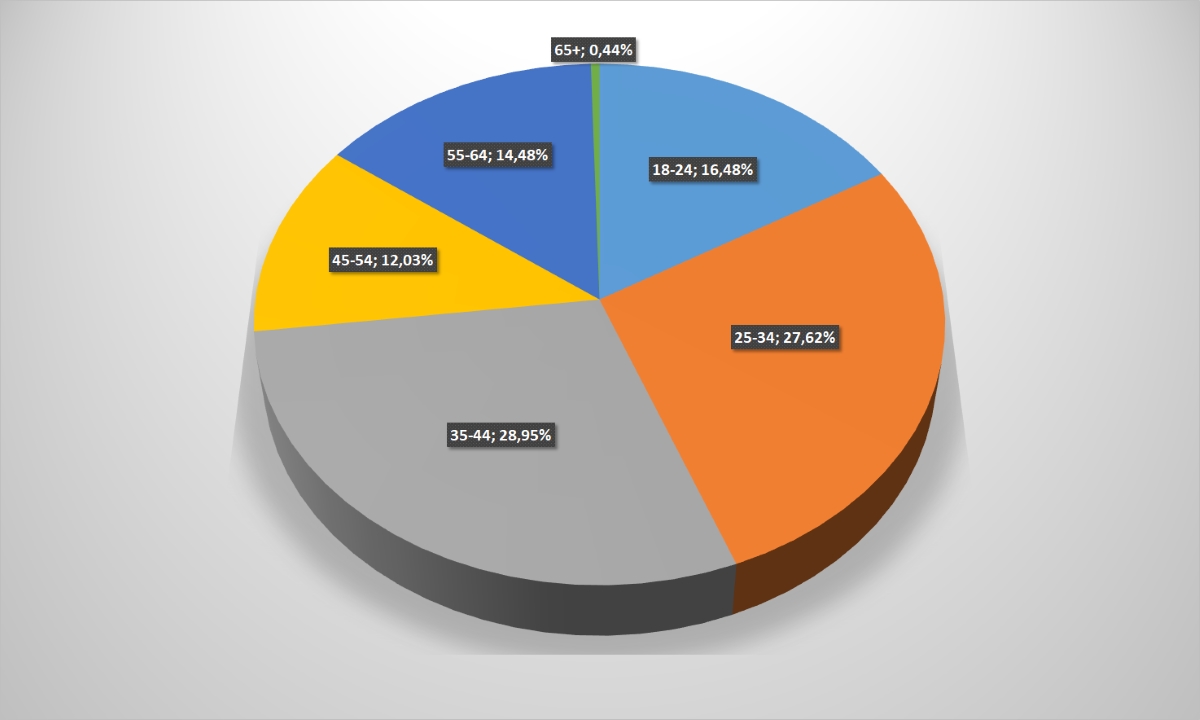
Indicators for the devices used to enter the online-store website also correlate well with the user’s age cut. Almost three quarters of customers are from 18 to 44 years, so 71% of visits are from smartphones and tablets. However, even older people buy cosmetics online: 14.5% of users are people aged 55-64 years, and almost 0.5% – at the 65+age.
Diagram: Devices employed by users to access the Internet (click on it to enlarge the picture)
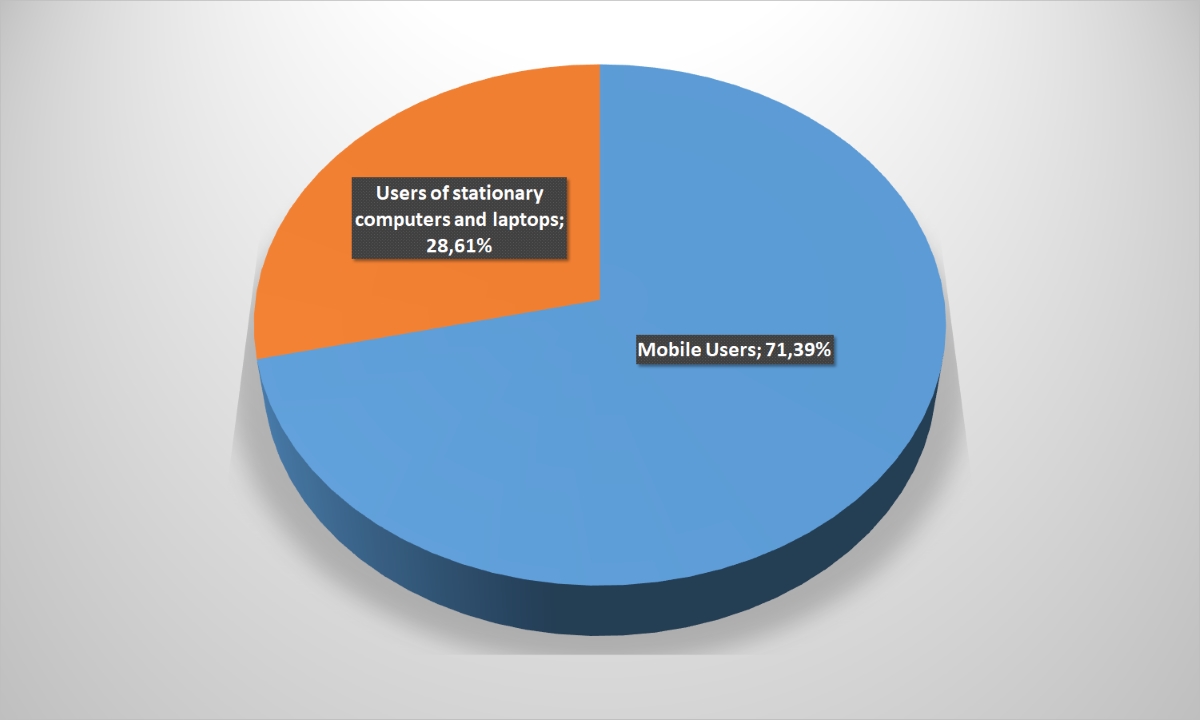
Diagram: Users age category (to enlarge the picture, click on it)
 The indicator of refusals to continue view is also “average market” – 39. It is a little worse than many other segments, but better than products for children and Internet-supermarkets.
Diagram: Percentage of failures (to enlarge the picture, click on it)
